Cardano (ADA) Crash Over? Key Buy Signal Just Triggered
Cardano (ADA) has seen sharp losses over recent weeks, in line with broader weakness across the crypto market.
Consequently, the asset is trading around $0.53 at press time, following a 3% drop over the past 24 hours. It has also fallen almost 18% in the past week and is down 37% over the last 30 days. After weeks of selling, new technical developments are drawing attention from market analysts.
TD Sequential Indicator Flags Possible Shift
Analyst Ali Martinez reported that the TD Sequential indicator has triggered a buy signal for ADA on the 3-day chart. The signal is identified by a red “9” candle, which often appears near the end of a downtrend.
Martinez shared the chart and asked,
While the signal does not confirm direction, it may point to a change in trend. ADA has faced selling pressure for most of October but is now attempting to hold support near $0.57. The market will likely need a clear breakout or volume pickup to confirm any move from here.
Meanwhile, recent data shows that whales have trimmed their ADA balances over the past few weeks, as CryptoPotato reported. This reduction may have contributed to the ongoing price weakness.
Key Support Holds as Analysts Eye $0.50 Level
Analyst CryptoPulse posted that ADA has now moved into a known demand zone, where the price has previously found support. The analyst noted,
Traders are watching the $0.50 mark, as it may offer a short-term base. If the level holds, it could support a recovery. If not, the recent trend may continue lower.
A separate chart analysis by OceanStaker outlines a Power of Three (PO3) pattern on the ADA/USDT pair. It shows that Cardano may have completed Phase 1 and is now entering Phase 2: accumulation. The level around $0.435 is seen as the potential base.
Technical indicators appear to support this structure. The RSI is at 38.06, moving toward oversold territory. The MACD remains negative, with both lines still trending down. If ADA holds support and these indicators shift, it may open the door for a breakout into Phase 3: expansion.
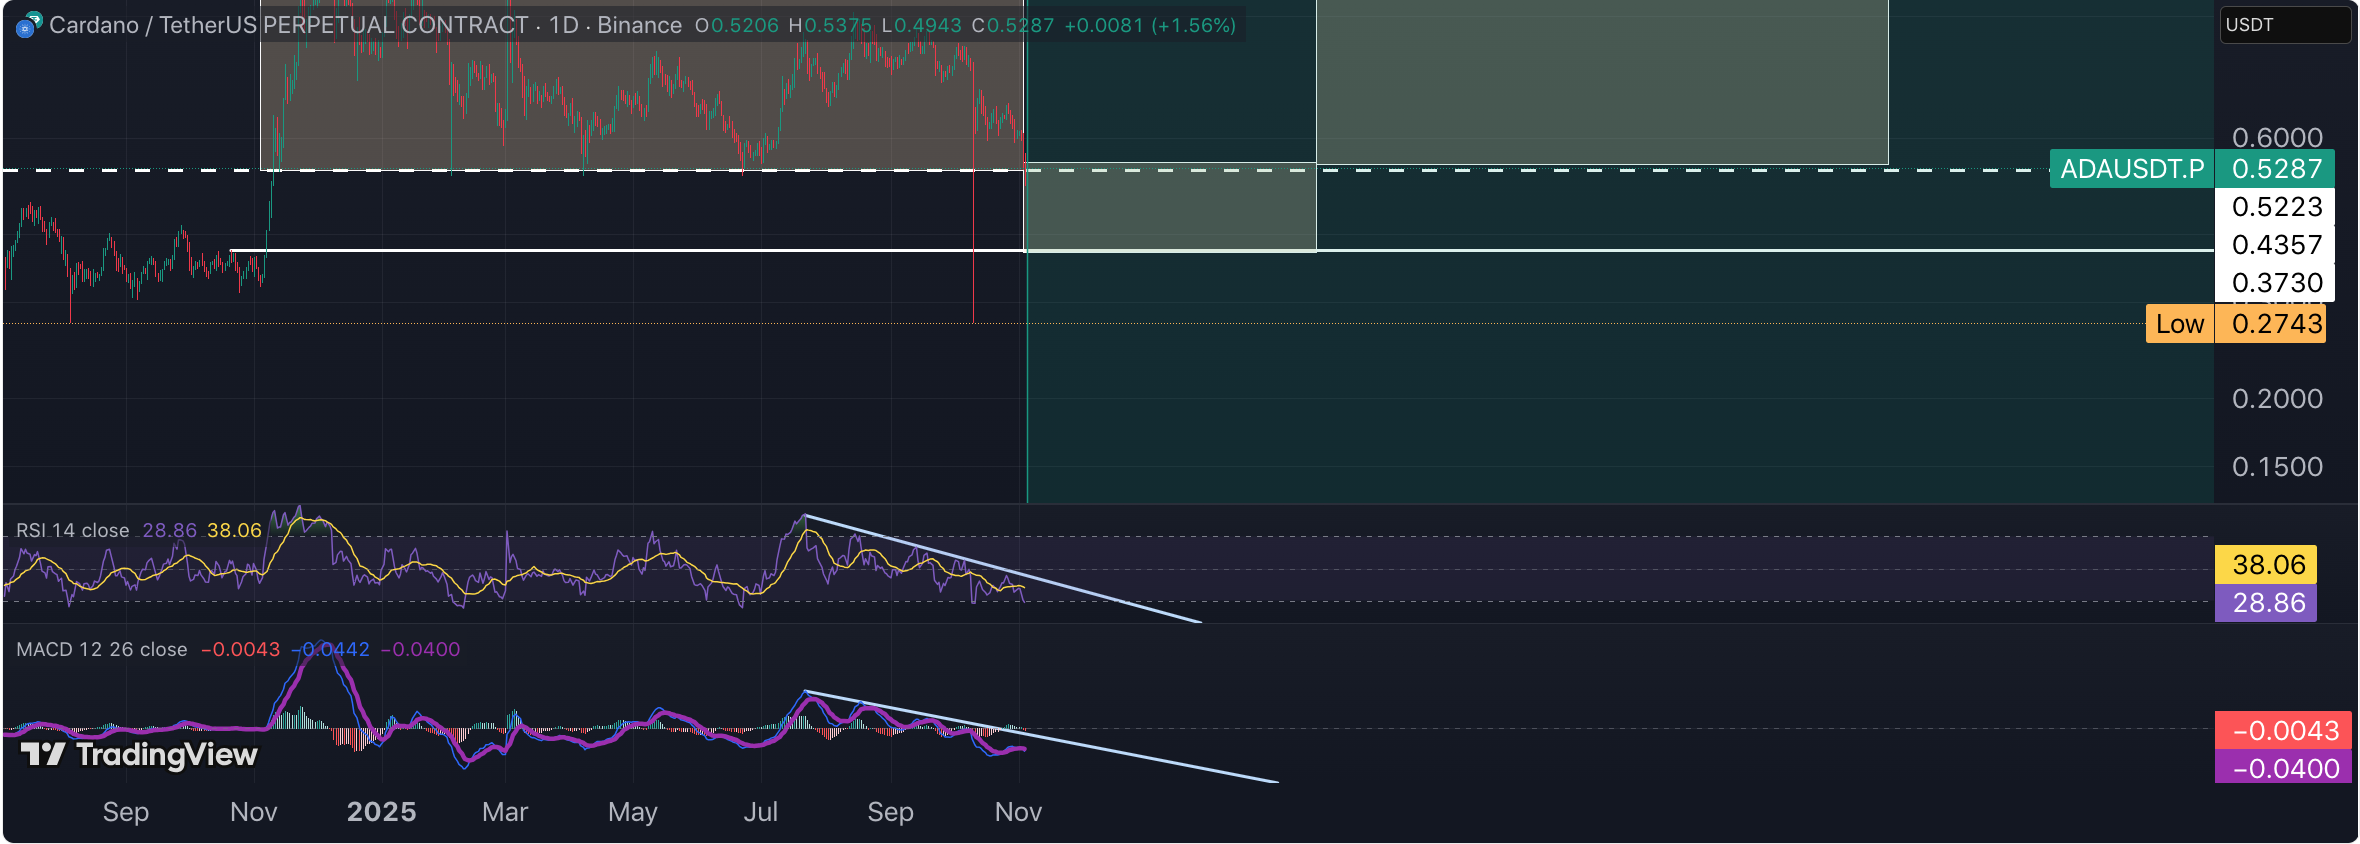 Source: OceanStaker/TradingView
Separately, Cardano was recently included in the REX-Osprey Top 10 Crypto Index ETF, which could bring more attention from investors who follow traditional financial products.
The post Cardano (ADA) Crash Over? Key Buy Signal Just Triggered appeared first on CryptoPotato.
Ayrıca Şunları da Beğenebilirsiniz

Binance Whale Loses $11.58 Million as Bitcoin Crashes Below $86,000

Tom Lee: Crypto's Best Years Lie Ahead as Adoption Gap Reveals Massive Growth Potential