This market is anything but predictable. First came the tariff escalations. Now, the threat of full-scale conflict between an Israel–U.S. coalition and Iran is dominating headlines. Investors across the board, from crypto to equities, are trying to make sense of the volatility, asking the big question: Why is crypto crashing today? Over the weekend, most.. The post Why is Crypto Crashing Today? Is Gold Price Dip a Better Buy Than Bitcoin? appeared first on 99Bitcoins .This market is anything but predictable. First came the tariff escalations. Now, the threat of full-scale conflict between an Israel–U.S. coalition and Iran is dominating headlines. Investors across the board, from crypto to equities, are trying to make sense of the volatility, asking the big question: Why is crypto crashing today? Over the weekend, most.. The post Why is Crypto Crashing Today? Is Gold Price Dip a Better Buy Than Bitcoin? appeared first on 99Bitcoins .

Why is Crypto Crashing Today? Is Gold Price Dip a Better Buy Than Bitcoin?

This market is anything but predictable. First came the tariff escalations. Now, the threat of full-scale conflict between an Israel–U.S. coalition and Iran is dominating headlines. Investors across the board, from crypto to equities, are trying to make sense of the volatility, asking the big question: Why is crypto crashing today?

Over the weekend, most major digital assets pulled back sharply. Global crypto market cap dropped 2.8% to $3.23 trillion, down from $3.37 trillion on Friday. Bitcoin (BTC) briefly dipped below $100,000, touching $98,300 before rebounding. It currently trades near $101,000, 9% off its all-time high of $112,000. Ethereum also slid 8% at one point, though it recovered to $2,251 after bouncing off $2,115.

Bitcoin
Price
Market Cap
BTC
$2.13T
24h7d30d1yAll time

Despite the dip, many analysts argue the pullback is a standard correction amid macro uncertainty. Others warn that the worst may still lie ahead. But zoom out, and the picture is clearer: Bitcoin continues to outperform both gold and the stock market, even in one of the most turbulent geopolitical environments in years.

Why Is Crypto Crashing Today? Bitcoin Remains Stable But Could Be  Gold a Better Buy?

With rising global tension and fading risk appetite, some investors are turning to gold, a classic safe-haven asset. While Bitcoin has often been seen as “digital gold,” recent behavior suggests that during times of real-world conflict, traditional assets may still hold the upper hand.

The crypto market is likely to remain volatile in the short term. Without signs of geopolitical de-escalation, Bitcoin could fall further below $100,000, and Ethereum may slide under $2,100. For now, markets are leaning defensive, and traders appear reluctant to bet on the upside.

Still, sharp dips like these may offer a chance to accumulate for long-term investors. For Bitcoin, the long-term outlook continues to be positive, with targets like $ 150,000 to $200,000 considered achievable by many experts.

The ongoing Israel-Iran conflict has only strengthened the case for both assets. Historically, gold has served as the traditional hedge during war and instability. But Bitcoin is increasingly viewed as a digital alternative for capital preservation, especially in a world of currency debasement and sovereign risk.

With threats to vital infrastructure and oil supply chains in the Middle East, investor demand for both assets could increase significantly. Should this safe-haven rally materialize, it could trigger breakouts above $3,500 in gold and $112,000 in Bitcoin, attracting new capital inflows into both markets.

Bitcoin vs. Gold: A Tale of Two Safe Havens

Gold (XAU/USD), traditionally the ultimate safe-haven asset, shows signs of fatigue. Despite heightened tensions, including U.S. airstrikes on Iranian nuclear sites, gold is struggling to stay above the $3,400 resistance level. In fact, fresh selling pressure has emerged, with traders wary of the Fed’s hawkish tone and the strengthening U.S. dollar.
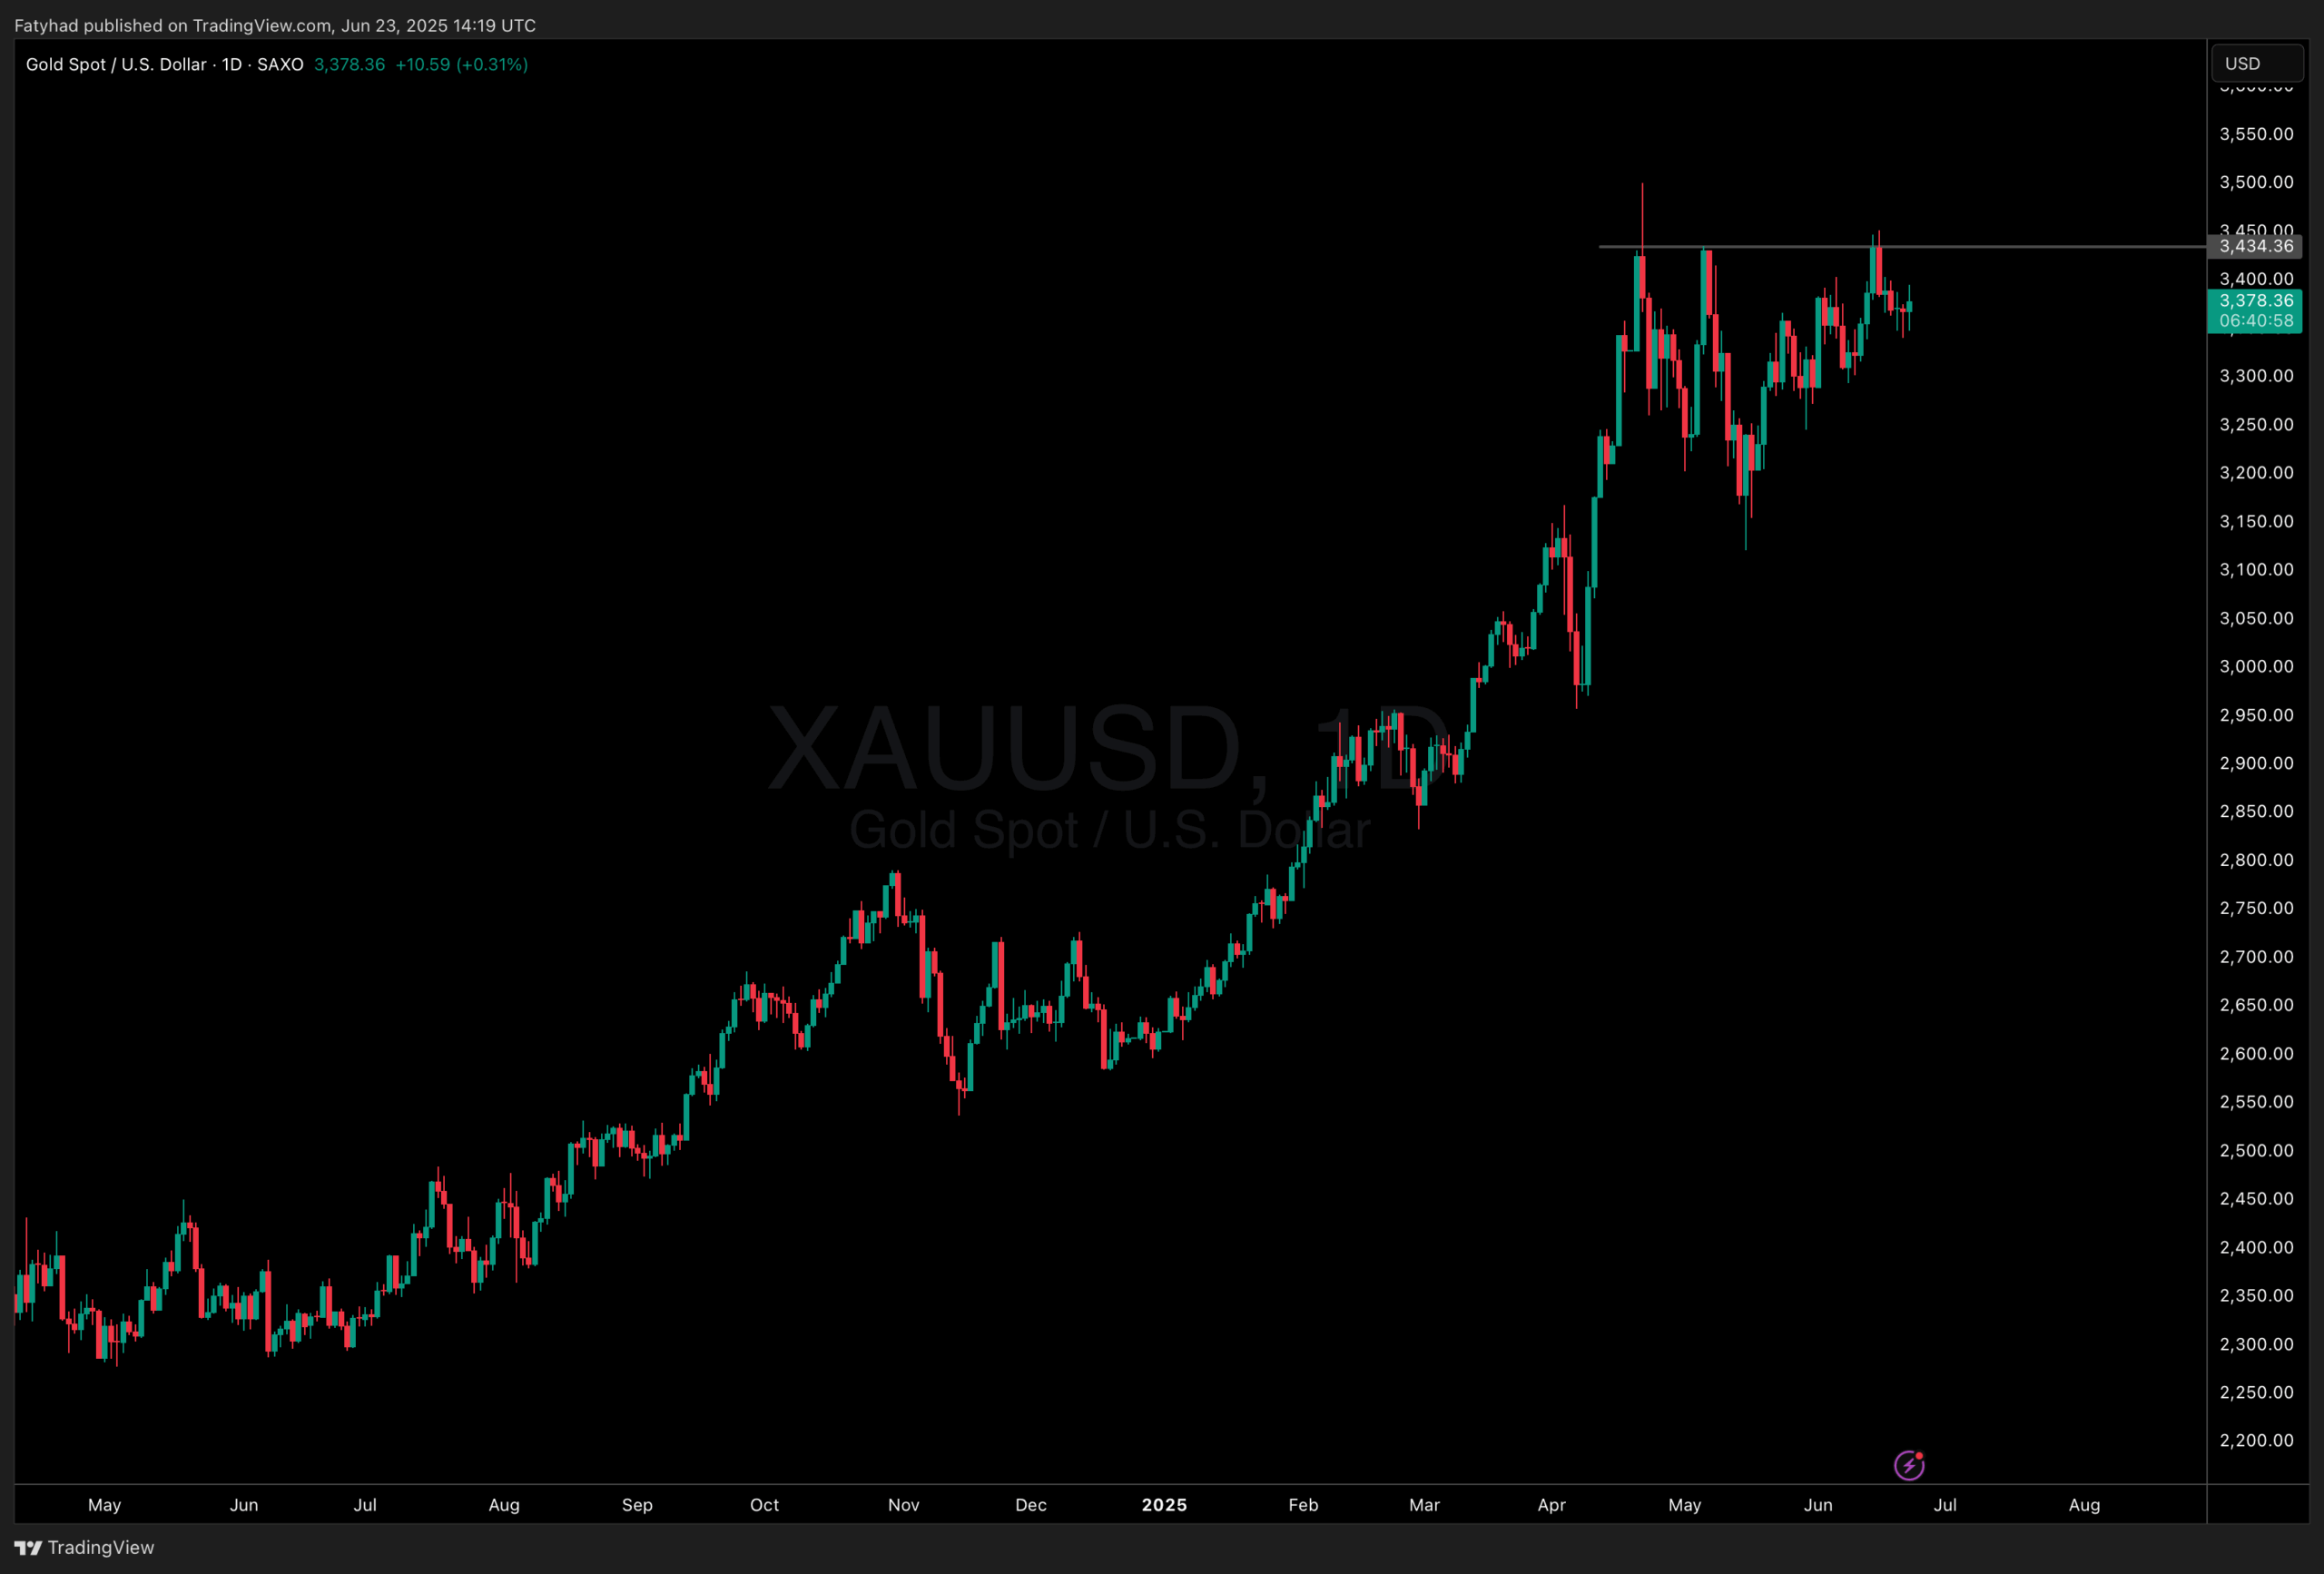
Why is cypto down today? Is gold a better choice than bitcoin?

(GOLDUSD)

Even with conflict escalating in the Middle East, gold’s upside has been capped. The market’s attention has shifted to the Federal Reserve’s cautious rate cut outlook. While two cuts are expected in 2025, just one small cut is projected for each of 2026 and 2027. This “higher for longer” stance makes non-yielding assets like gold less attractive, especially as the dollar gains ground.

Technically, gold looks vulnerable. A break below $3,322 could open the door to sub-$3,300 territory. Meanwhile, a push above $3,400 could lead to a retest of $3,435–$3,500, though momentum appears weak.

The Bigger Picture: Bitcoin Still Leads All Markets

Yes, short-term volatility remains high. But Bitcoin’s strength during this period of global stress reinforces its position as not only the top-performing crypto, but arguably the most resilient asset in the world right now.

While the S&P 500 and Nasdaq remain sensitive to rate expectations, economic data, and gold struggles to reclaim its highs, Bitcoin has carved out a unique position. It’s increasingly viewed not just as digital gold, but as a superior hedge in a new era of sovereign risk, debt instability, and geopolitical unpredictability.

If markets remain unstable, capital may continue flowing into Bitcoin and this pullback may turn out to be one of the last big opportunities before the next leg up.

EXPLORE: What Are the Best New Presales to Buy in June 2025?

The post Why is Crypto Crashing Today? Is Gold Price Dip a Better Buy Than Bitcoin? appeared first on 99Bitcoins.

Piyasa Fırsatı
Nowchain Logosu
Nowchain Fiyatı(NOW)
$0.00236
$0.00236$0.00236
-2.47%
USD
Nowchain (NOW) Canlı Fiyat Grafiği
Sorumluluk Reddi: Bu sitede yeniden yayınlanan makaleler, halka açık platformlardan alınmıştır ve yalnızca bilgilendirme amaçlıdır. MEXC'nin görüşlerini yansıtmayabilir. Tüm hakları telif sahiplerine aittir. Herhangi bir içeriğin üçüncü taraf haklarını ihlal ettiğini düşünüyorsanız, kaldırılması için lütfen [email protected] ile iletişime geçin. MEXC, içeriğin doğruluğu, eksiksizliği veya güncelliği konusunda hiçbir garanti vermez ve sağlanan bilgilere dayalı olarak alınan herhangi bir eylemden sorumlu değildir. İçerik, finansal, yasal veya diğer profesyonel tavsiye niteliğinde değildir ve MEXC tarafından bir tavsiye veya onay olarak değerlendirilmemelidir.

Ayrıca Şunları da Beğenebilirsiniz

REX Shares’ Solana staking ETF sees $10M inflows, AUM tops $289M for first time

REX Shares’ Solana staking ETF sees $10M inflows, AUM tops $289M for first time

The post REX Shares’ Solana staking ETF sees $10M inflows, AUM tops $289M for first time appeared on BitcoinEthereumNews.com. Key Takeaways REX Shares’ Solana staking ETF saw $10 million in inflows in one day. Total inflows over the past three days amount to $23 million. REX Shares’ Solana staking ETF recorded $10 million in inflows yesterday, bringing total additions to $23 million over the past three days. The fund’s assets under management climbed above $289.0 million for the first time. The SSK ETF is the first U.S. exchange-traded fund focused on Solana staking. Source: https://cryptobriefing.com/rex-shares-solana-staking-etf-aum-289m/
Paylaş
BitcoinEthereumNews2025/09/18 02:34
Microsoft Corp. $MSFT blue box area offers a buying opportunity

Microsoft Corp. $MSFT blue box area offers a buying opportunity

The post Microsoft Corp. $MSFT blue box area offers a buying opportunity appeared on BitcoinEthereumNews.com. In today’s article, we’ll examine the recent performance of Microsoft Corp. ($MSFT) through the lens of Elliott Wave Theory. We’ll review how the rally from the April 07, 2025 low unfolded as a 5-wave impulse followed by a 3-swing correction (ABC) and discuss our forecast for the next move. Let’s dive into the structure and expectations for this stock. Five wave impulse structure + ABC + WXY correction $MSFT 8H Elliott Wave chart 9.04.2025 In the 8-hour Elliott Wave count from Sep 04, 2025, we saw that $MSFT completed a 5-wave impulsive cycle at red III. As expected, this initial wave prompted a pullback. We anticipated this pullback to unfold in 3 swings and find buyers in the equal legs area between $497.02 and $471.06 This setup aligns with a typical Elliott Wave correction pattern (ABC), in which the market pauses briefly before resuming its primary trend. $MSFT 8H Elliott Wave chart 7.14.2025 The update, 10 days later, shows the stock finding support from the equal legs area as predicted allowing traders to get risk free. The stock is expected to bounce towards 525 – 532 before deciding if the bounce is a connector or the next leg higher. A break into new ATHs will confirm the latter and can see it trade higher towards 570 – 593 area. Until then, traders should get risk free and protect their capital in case of a WXY double correction. Conclusion In conclusion, our Elliott Wave analysis of Microsoft Corp. ($MSFT) suggested that it remains supported against April 07, 2025 lows and bounce from the blue box area. In the meantime, keep an eye out for any corrective pullbacks that may offer entry opportunities. By applying Elliott Wave Theory, traders can better anticipate the structure of upcoming moves and enhance risk management in volatile markets. Source: https://www.fxstreet.com/news/microsoft-corp-msft-blue-box-area-offers-a-buying-opportunity-202509171323
Paylaş
BitcoinEthereumNews2025/09/18 03:50
The Digital WOW Explains How AI Is Affecting Digital Marketing

The Digital WOW Explains How AI Is Affecting Digital Marketing

WEST PALM BEACH, Fla., Dec. 19, 2025 /PRNewswire/ — The Digital WOW, powered by ConsultPR.net, announces new findings on how AI is affecting digital marketing.
Paylaş
AI Journal2025/12/19 17:30