KAITO Price Prediction 2025–2029: Can KAITO Hit $1.05 Soon?
- KAITO Attempts a Relief Rally After Sharp Intraday Surge
- Short covering flips momentum, but heavy resistance still caps upside.
- Overhead EMAs signal sellers remain in control of the broader trend.
KAITO price today trades near $0.61 after a sharp intraday surge that pushed the token more than 25% higher within hours. The move follows a prolonged downtrend and marks the first meaningful bounce from the $0.49–$0.50 demand base that has repeatedly attracted dip buyers over the past month.
While the rally has shifted short-term momentum back toward buyers, the broader market structure remains bearish. KAITO is now pressing into a thick resistance zone formed by prior distribution and declining moving averages. The coming sessions will be critical in determining whether this move develops into a sustained recovery or fades as another relief rally.
Also Read: Terra Classic (LUNC) Price Prediction 2025–2029: Will LUNC Hit $0.0001 Soon?
KAITO’s Bounce Signals Momentum Shift, Not Trend Reversal
KAITO rebounded from the lower boundary of a descending channel that has guided price lower since October, finding support near $0.50. This zone has acted as a consistent demand pocket, absorbing sell pressure during recent pullbacks.
The rally pushed price above the 20-day EMA near $0.56 and flipped the Supertrend bullish around $0.43, signaling that short-term control has shifted toward buyers. However, the broader trend remains intact. The 50-day EMA near $0.67 and 100-day EMA near $0.83 continue to slope lower, forming a heavy overhead supply band.
Until KAITO can reclaim at least the 50-day EMA on a daily close, the move remains corrective rather than a confirmed trend reversal.
Intraday Spike Highlights Aggressive Short Covering
Lower-timeframe price action reveals the true nature of the rally. On the one-hour chart, KAITO printed a near-vertical candle from the $0.50 region to highs above $0.64, followed by immediate consolidation near $0.60.
During the breakout, RSI surged above 80 before cooling back toward the mid-60s, behavior typically associated with forced short covering rather than steady accumulation. Parabolic SAR flipped decisively bullish during the spike, but price is now hovering close to its short-term flip zone. This type of price action often signals exhaustion if follow-through fails, leaving breakout buyers dependent on continued momentum to avoid a rapid retracement.
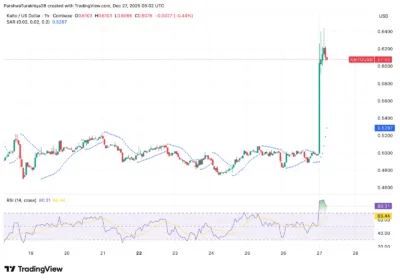
Source: Tradingview
Relief Pump Meets Heavy Overhead Resistance
From a structural perspective, KAITO is now testing the underside of prior support turned resistance. The $0.62–$0.67 zone aligns with the late-November breakdown area and the declining 50-day EMA, making it a critical decision region.
Repeated rejection in this zone would suggest that sellers are still defending rallies and using strength to exit positions. A failure here would likely send price back toward $0.55, with deeper support resting again near $0.50.
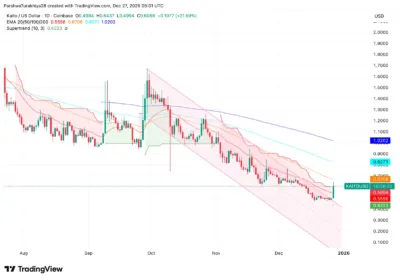
Source: Tradingview
The broader EMA alignment reinforces this risk. With the 100-day EMA near $0.83 and the 200-day EMA above $1.00, the long-term trend remains decisively bearish, and any upside move must absorb multiple layers of overhead supply.
Market Sentiment Remains Tactical, Not Conviction-Based
Community sentiment around KAITO has turned active but remains cautious. Traders widely frame the move as a Coinbase-driven pump, rather than a fundamental repricing of the asset. The dominant strategy discussed across social channels emphasizes selling relief rallies, taking fast profits, and waiting for dips instead of chasing breakouts.
This tone reflects broader ecosystem frustration. Several Kaito Kickstarter-backed projects experienced sharp post-TGE valuation drawdowns in December, reinforcing skepticism toward sustained upside. While the platform has rolled out leaderboard upgrades focused on on-chain identity checks and stricter reputation thresholds, the market response has remained muted so far.
These improvements may enhance long-term credibility, but they have yet to translate into consistent demand for the KAITO token itself.
Support and Resistance Levels: KAITO at a Decision Point
For the bullish case to gain traction, KAITO must hold above $0.58 and secure a daily close above $0.67. Acceptance above this level would confirm a reclaim of the 50-day EMA and open the door toward $0.75, followed by $0.83.
On the downside, failure to hold $0.58, followed by a break below $0.55, would indicate that the rally was purely corrective. Losing $0.50 would place KAITO back into full trend continuation toward the lower boundary of the descending channel.
Bullish and Bearish Scenarios for KAITO
A daily close above $0.67 with expanding volume would signal acceptance above key resistance. This could trigger a move toward $0.75–$0.83, marking the first structural improvement since October.
Rejection in the $0.62–$0.67 zone followed by a loss of $0.55 would confirm seller dominance. A breakdown below $0.50 would resume the broader downtrend and invalidate the recent momentum shift.
KAITO Price Prediction 2025–2029
| Year | Minimum Price | Average Price | Maximum Price |
| 2025 | $0.45 | $0.60 | $0.75 |
| 2026 | $0.50 | $0.70 | $0.90 |
| 2027 | $0.60 | $0.85 | $1.05 |
| 2028 | $0.70 | $0.95 | $1.15 |
| 2029 | $0.80 | $1.05 | $1.25 |
2025
KAITO enters 2025 attempting to stabilize after a prolonged downtrend. If price can reclaim the 50-day EMA and hold above $0.67, a recovery toward $0.75–$0.83 becomes possible. Failure to do so would keep price locked in a bearish structure.
2026
Assuming gradual structural improvement, KAITO could trade in a broader $0.50–$0.90 range as sellers thin out and volatility compresses.
2027–2028
If ecosystem credibility improves and sustained demand emerges, KAITO could steadily push toward the $1.00 level, though upside would likely remain volatile and cyclical.
2029
By 2029, a full trend reversal could see KAITO trading above $1.00, provided long-term resistance zones are cleared and market confidence returns.
Conclusion
KAITO’s recent surge has shifted short-term momentum but has not yet changed the broader bearish trend. The rally appears driven primarily by short covering rather than sustained accumulation, leaving price vulnerable near key resistance levels. Until KAITO can decisively reclaim the $0.67 resistance and 50-day EMA, sellers remain in control of the bigger picture.
The coming days will determine whether this move evolves into a genuine recovery or fades as another relief rally within a downtrend. For now, KAITO sits at a critical inflection point — momentum has flipped, but conviction has not.
FAQs
1. Why did KAITO price surge recently?
The surge was driven by aggressive short covering after price bounced from the $0.50 support zone, triggering a rapid intraday breakout.
2. Is KAITO’s rally sustainable?
Sustainability depends on whether price can hold above $0.58 and reclaim the 50-day EMA near $0.67. Without that, the move remains corrective.
3. What is the key resistance for KAITO?
The primary resistance zone lies between $0.62 and $0.67, aligning with prior breakdown levels and the declining 50-day EMA.
4. Could KAITO return to $0.50?
Yes. Failure to hold $0.55 would likely lead to a retest of the $0.50 demand base.
5. What is KAITO’s long-term outlook?
Long-term prospects depend on reclaiming higher-timeframe resistance and restoring market confidence. Until then, KAITO remains in a broader bearish structure despite short-term momentum shifts.
Also Read: Ethereum Classic (ETC) Price Prediction 2025–2029: Can ETC Hit $20 Soon?
The post KAITO Price Prediction 2025–2029: Can KAITO Hit $1.05 Soon? appeared first on 36Crypto.
Ayrıca Şunları da Beğenebilirsiniz

North America Sees $2.3T in Crypto

What Happened With Bitcoin This Year? 2025 BTC Roundup