

3 Altcoins Crypto Whales are Buying After Supreme Court’s Trump Tariff Ban
The Supreme Court’s decision to ban Donald Trump’s tariffs has quietly shifted global market sentiment. Stocks reacted first, but crypto whales appear to be moving as well. BeInCrypto analysts tracking blockchain flows have identified early accumulation across three altcoins, signaling positioning ahead of a potential liquidity shift.
Tariff removal can ease inflation pressure and improve risk appetite, conditions that often favor speculative assets. This suggests crypto whales may already be preparing for the next phase of macro-driven crypto momentum, provided the positive sentiment holds.
Pump.fun (PUMP)
Crypto whales are buying Pump.fun (PUMP), one of the earliest infrastructure plays tied to speculative activity. Platforms like Pump.fun tend to benefit first when risk appetite improves, because they sit at the center of high-risk token launches.
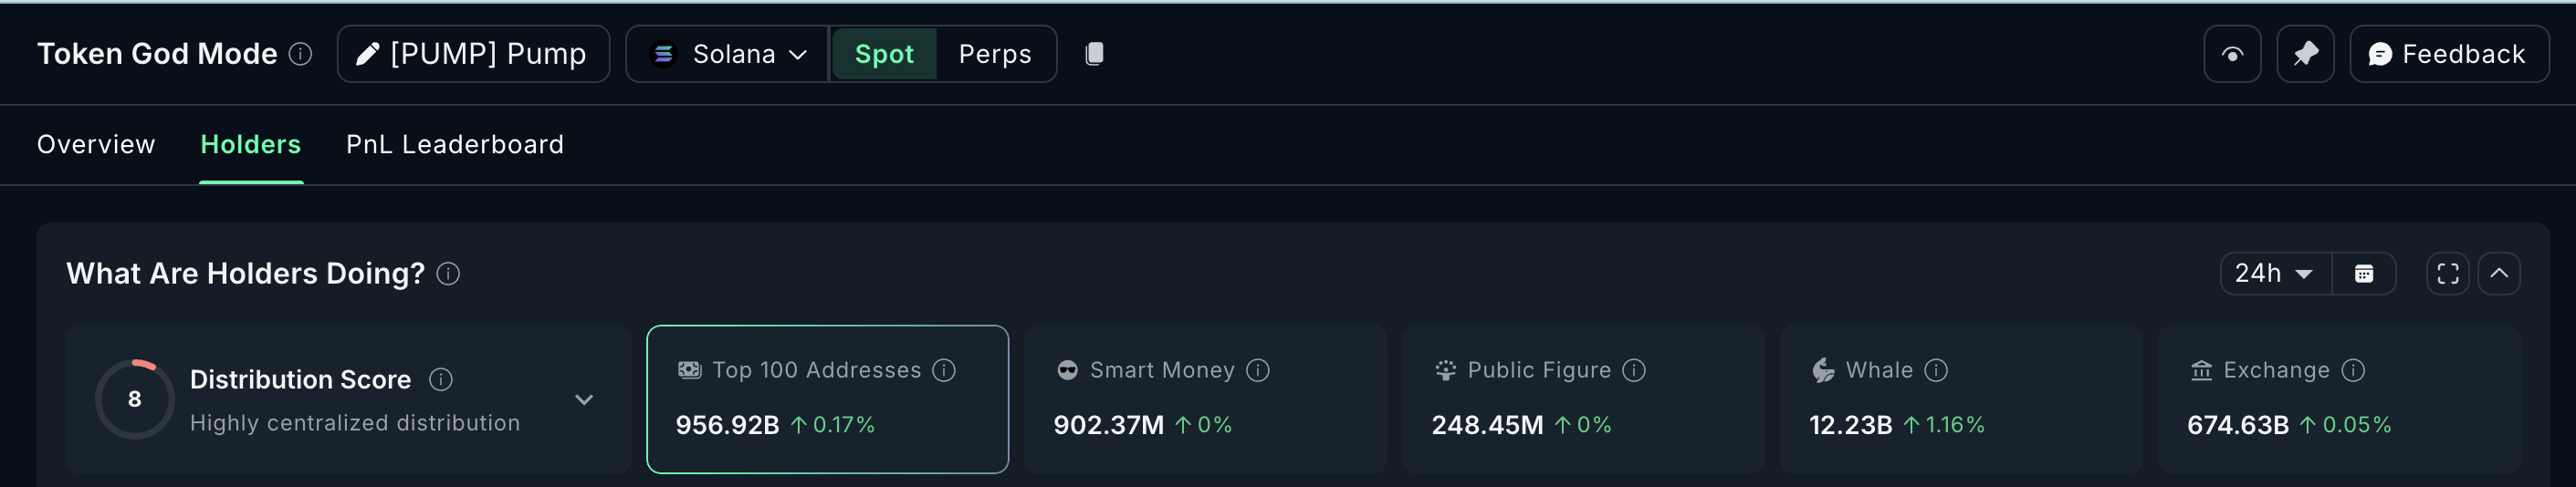
On-chain data shows whale holdings rose 1.16% in the past 24 hours, bringing their total stash to 12.23 billion PUMP. This means whales added roughly 140 million PUMP tokens in a single day.
At the current price, this equals about $280,000 worth of accumulation. While not an aggressive spike, it signals early positioning rather than late chasing, reflecting cautious optimism.
 Pump.Fun Whales: Nansen
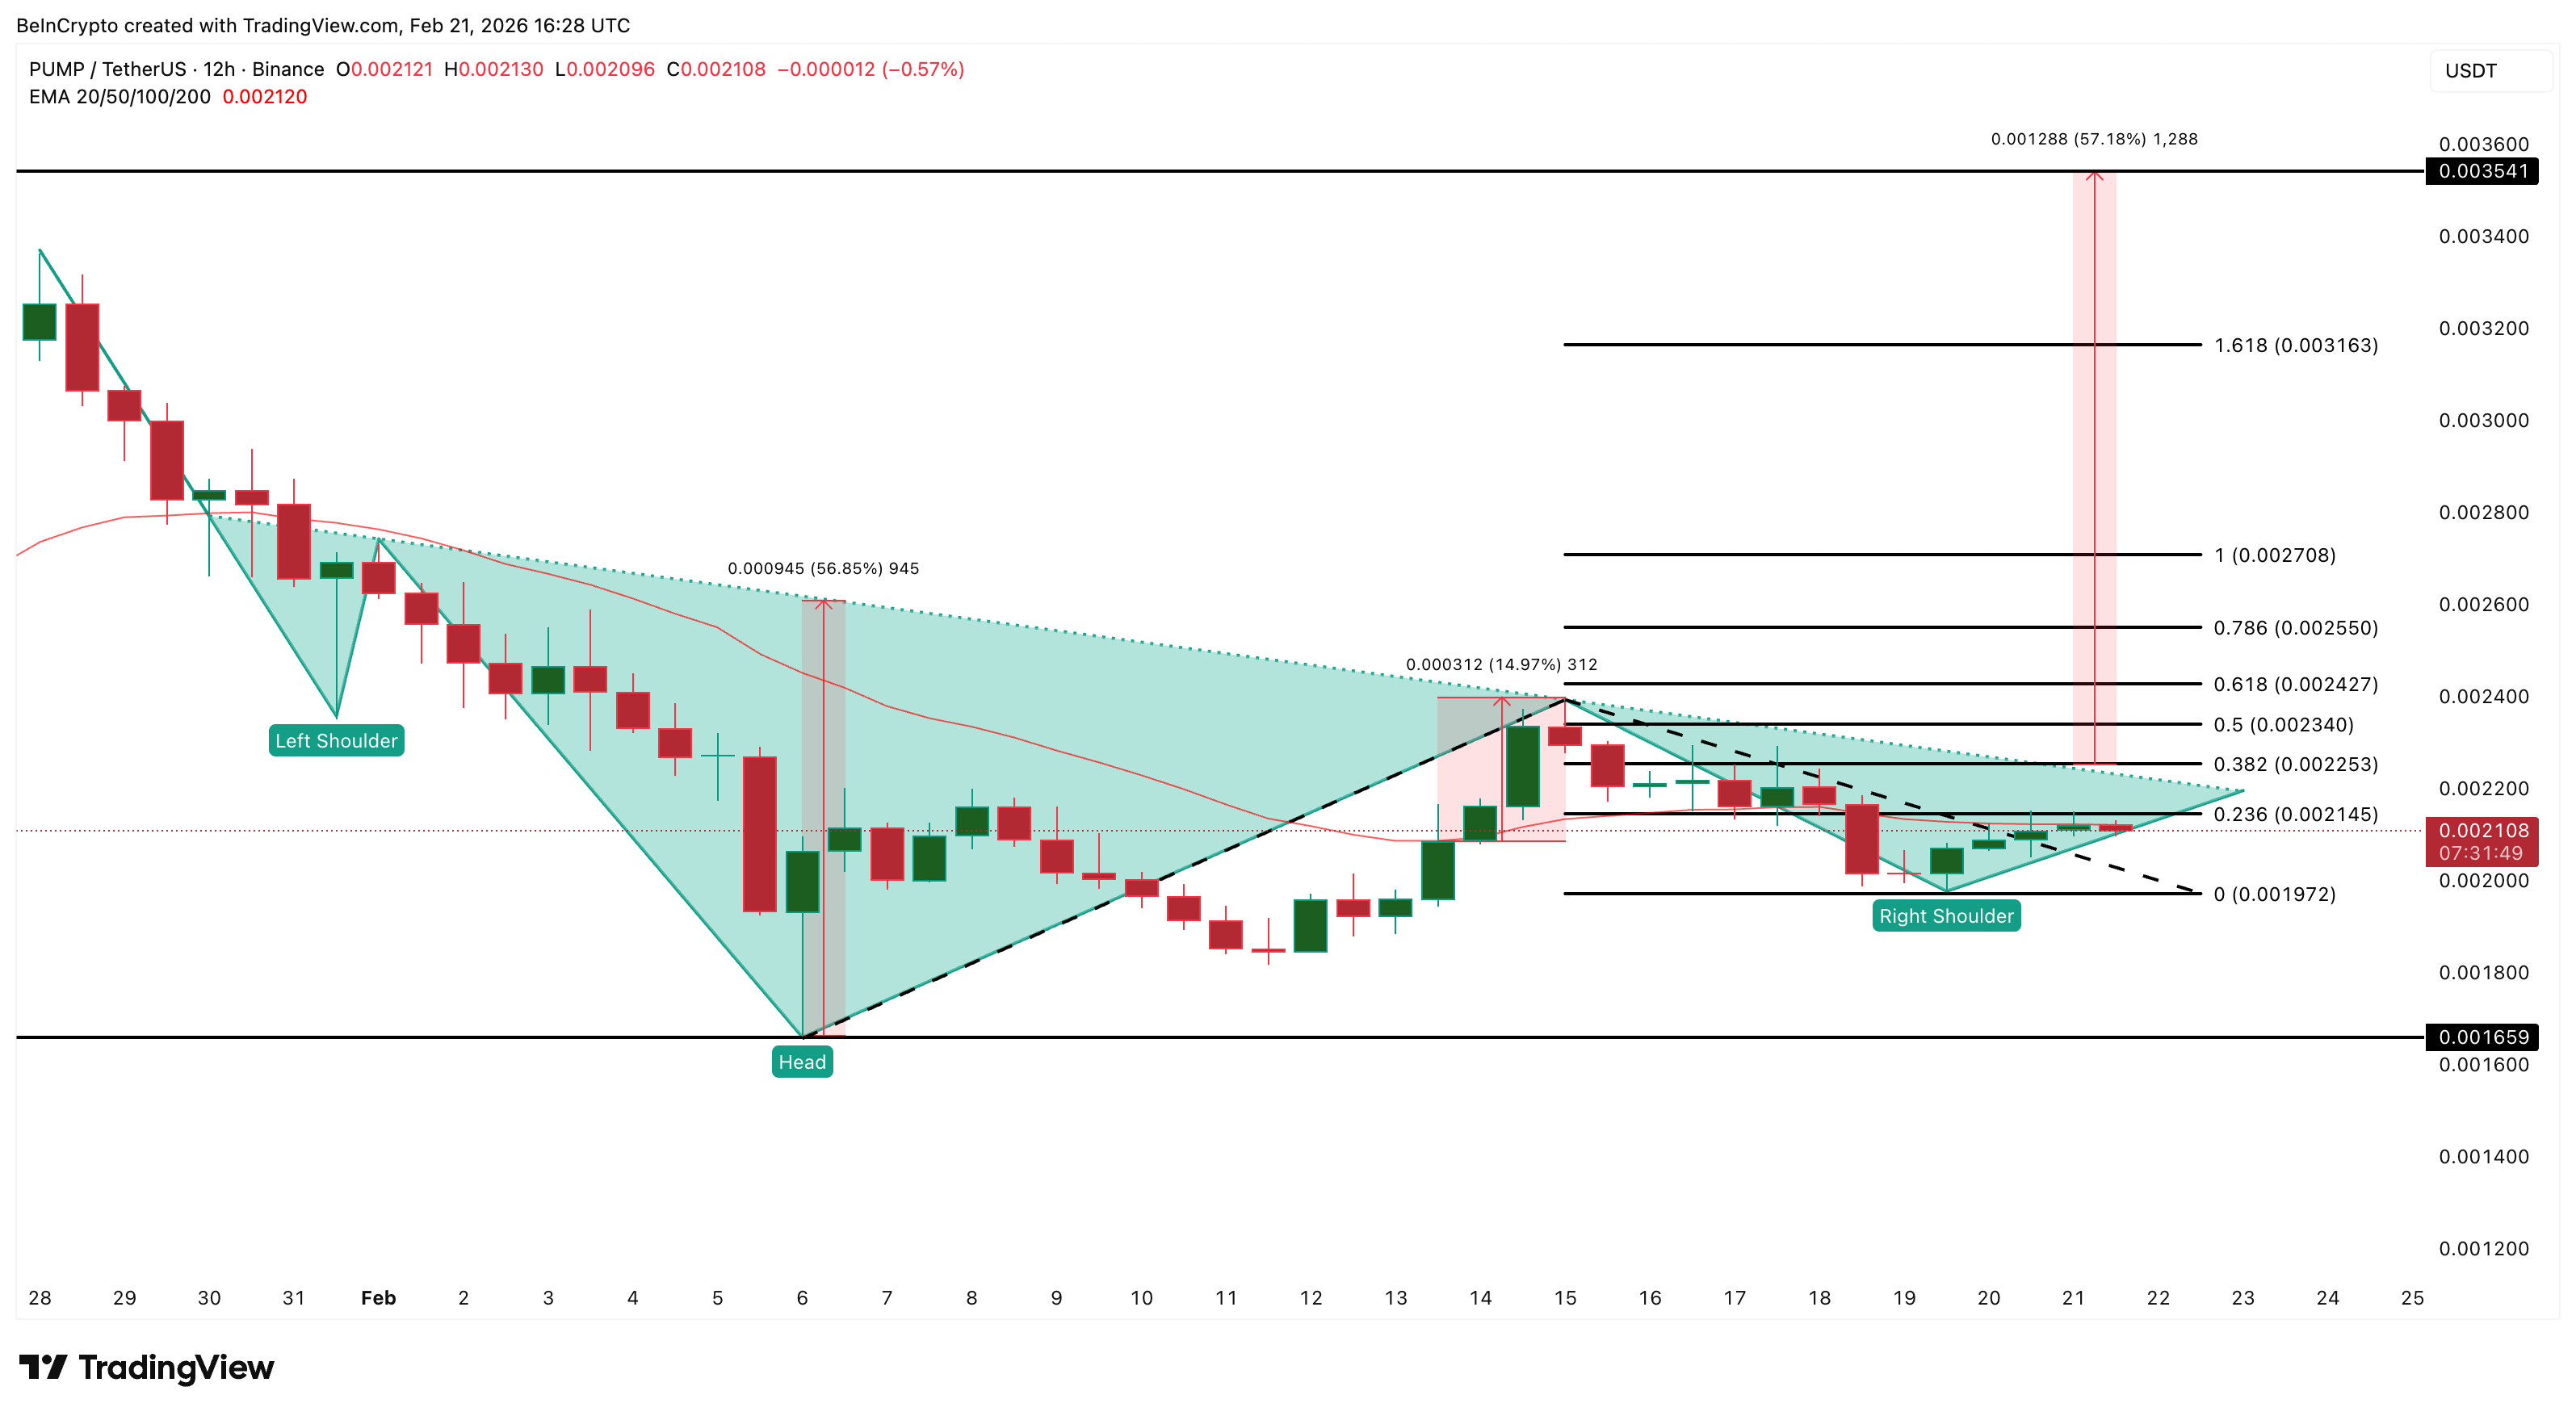
The answer behind this behavior may lie in the price chart. PUMP is currently forming an inverse head-and-shoulders pattern on the 12-hour chart. This is a bullish reversal structure that appears when selling pressure fades and buyers begin regaining control.
The neckline resistance sits near $0.0022, and a confirmed breakout above this level could open the path toward $0.0035, representing a potential upside of over 55%
 PUMP Price Analysis: TradingView
Momentum is already building. PUMP is now testing its 20-period Exponential Moving Average (EMA), which tracks the average price while giving more weight to recent moves.
Traders use this level to judge short-term strength. The last time PUMP reclaimed this EMA on February 13, it rallied nearly 15% shortly after. A similar rally can push the PUMP price past the neckline.
However, risks remain. A drop below $0.0019 would weaken momentum, while a fall under $0.0016 would invalidate the bullish setup entirely.
This explains why crypto whales are accumulating gradually. They appear to be positioning early for a PUMP price breakout, but are still respecting the current market structure.
Synthetix (SNX)
Crypto whales are buying Synthetix (SNX), but a deeper look shows it is mainly mega whales leading the move. This shift comes after the Supreme Court’s Trump tariff ban improved risk appetite. When macro uncertainty drops, large investors often rotate into higher-beta DeFi tokens that can rise faster.
Synthetix fits this profile because it powers synthetic assets, which tend to attract activity when traders expect stronger market momentum.
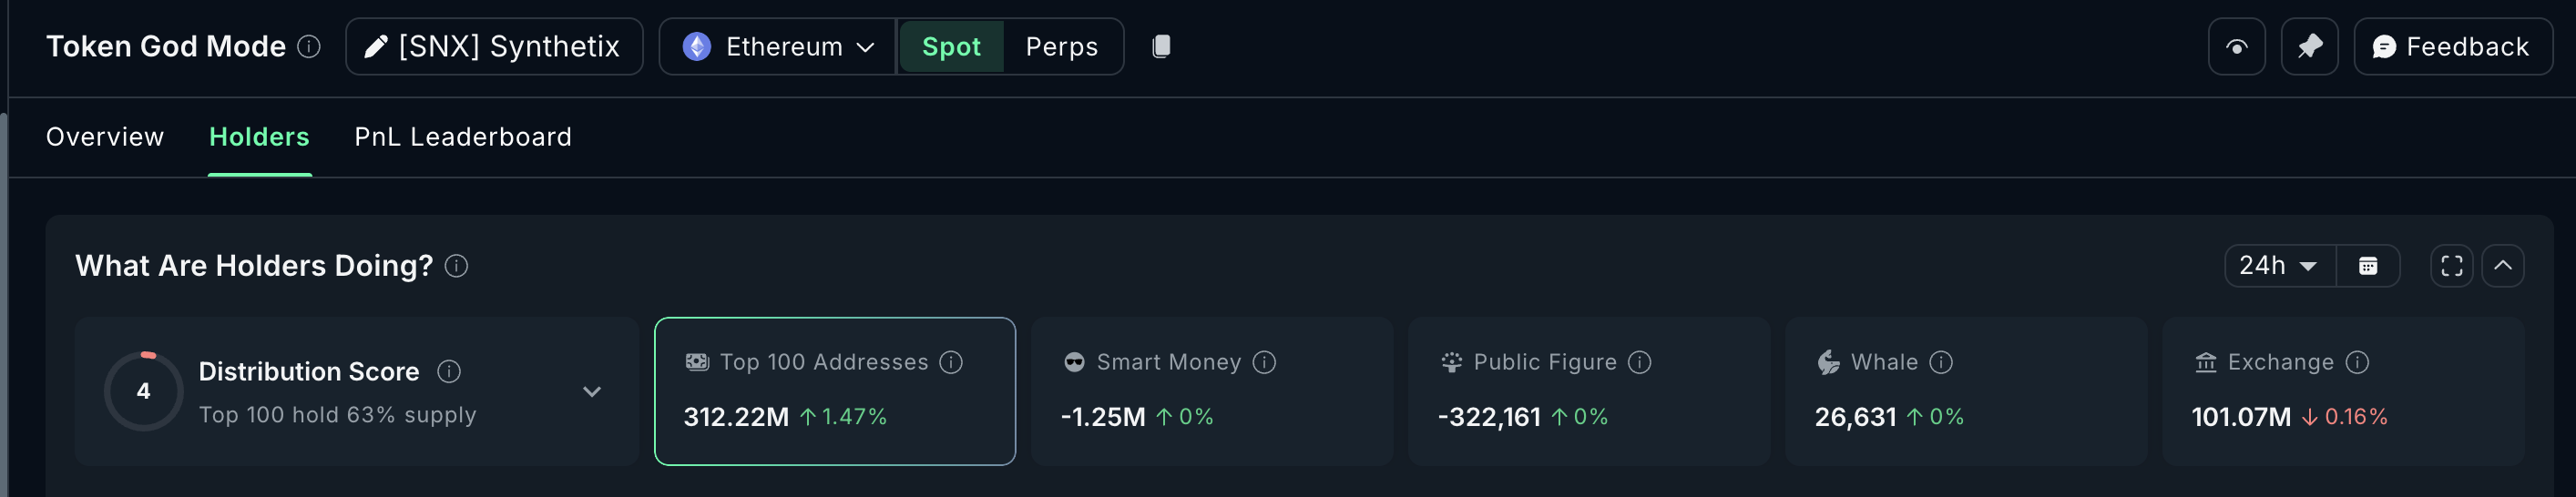
The data confirms this selective accumulation. The top 100 addresses increased their holdings by 1.47%, bringing their total stash to 312.22 million SNX.
 Synthetix Whales: Nansen
Want more token insights like this? Sign up for Editor Harsh Notariya’s Daily Crypto Newsletter here.
That means they added roughly 4.52 million SNX in the past 24 hours. At the current price, this equals about $1.83 million worth of SNX accumulated. This is important because mega whales are buying during strength, not weakness. This usually signals positioning for continuation, not just dip buying.
The chart explains why.
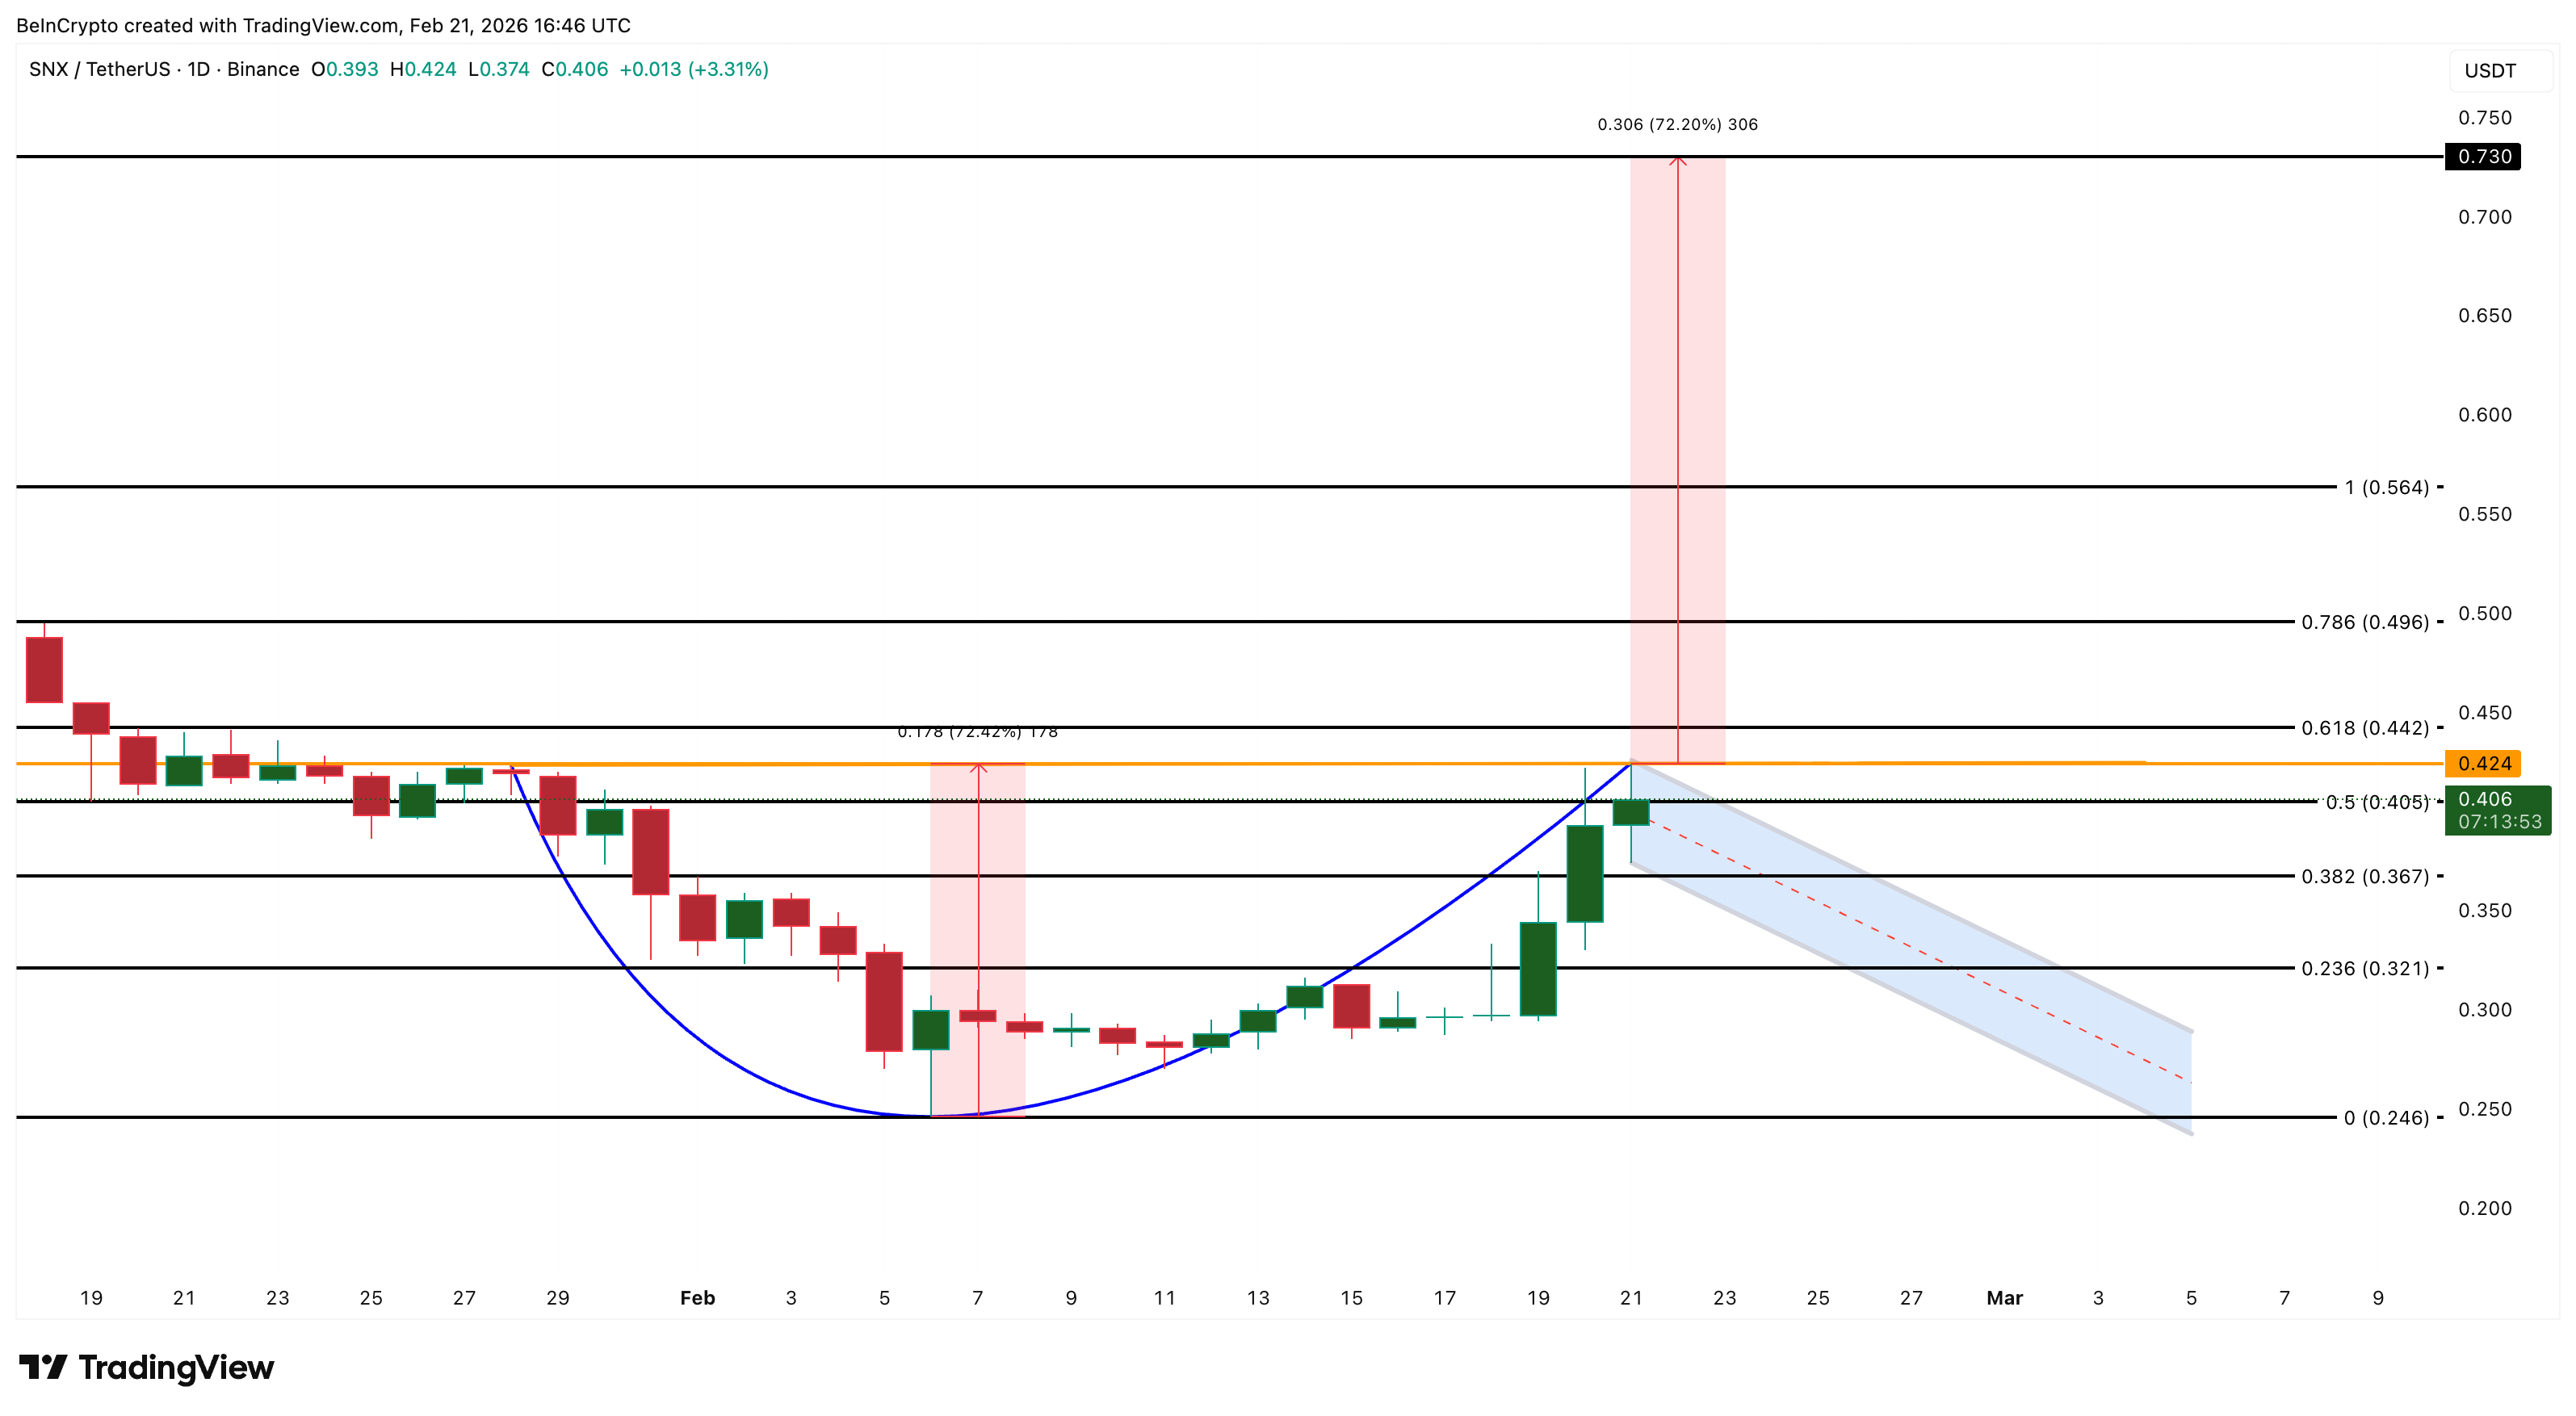
SNX appears to be forming a cup and handle pattern, which is a bullish continuation structure. This pattern starts with a rounded recovery, followed by a smaller pullback called the handle. The handle might soon be forming, which means consolidation may happen before the next move.
The key breakout level sits at $0.42. If SNX breaks and shows acceptance above this level, the pattern projection suggests a possible 72% rally toward $0.73.
This potential explains why mega whales are positioning early. They are likely willing to sit through consolidation, while smaller whales hesitate.
 SNX Price Analysis: TradingView
On the downside, $0.36 and $0.32 are important support levels during consolidation. These levels allow the handle to form normally. However, a drop below $0.24 would invalidate the bullish pattern completely.
Onyxcoin (XCN)
Onyxcoin (XCN) is the third token where crypto whales have quietly increased exposure after the Supreme Court’s Trump tariff ban. Whale holdings rose from 48.84 billion to 48.96 billion XCN, adding 120 million tokens in one day. At the current price, this amounts to roughly $612,000 in XCN accumulated.
This buying comes despite weak recent performance, suggesting whales may be positioning early for a reversal rather than reacting to strength.
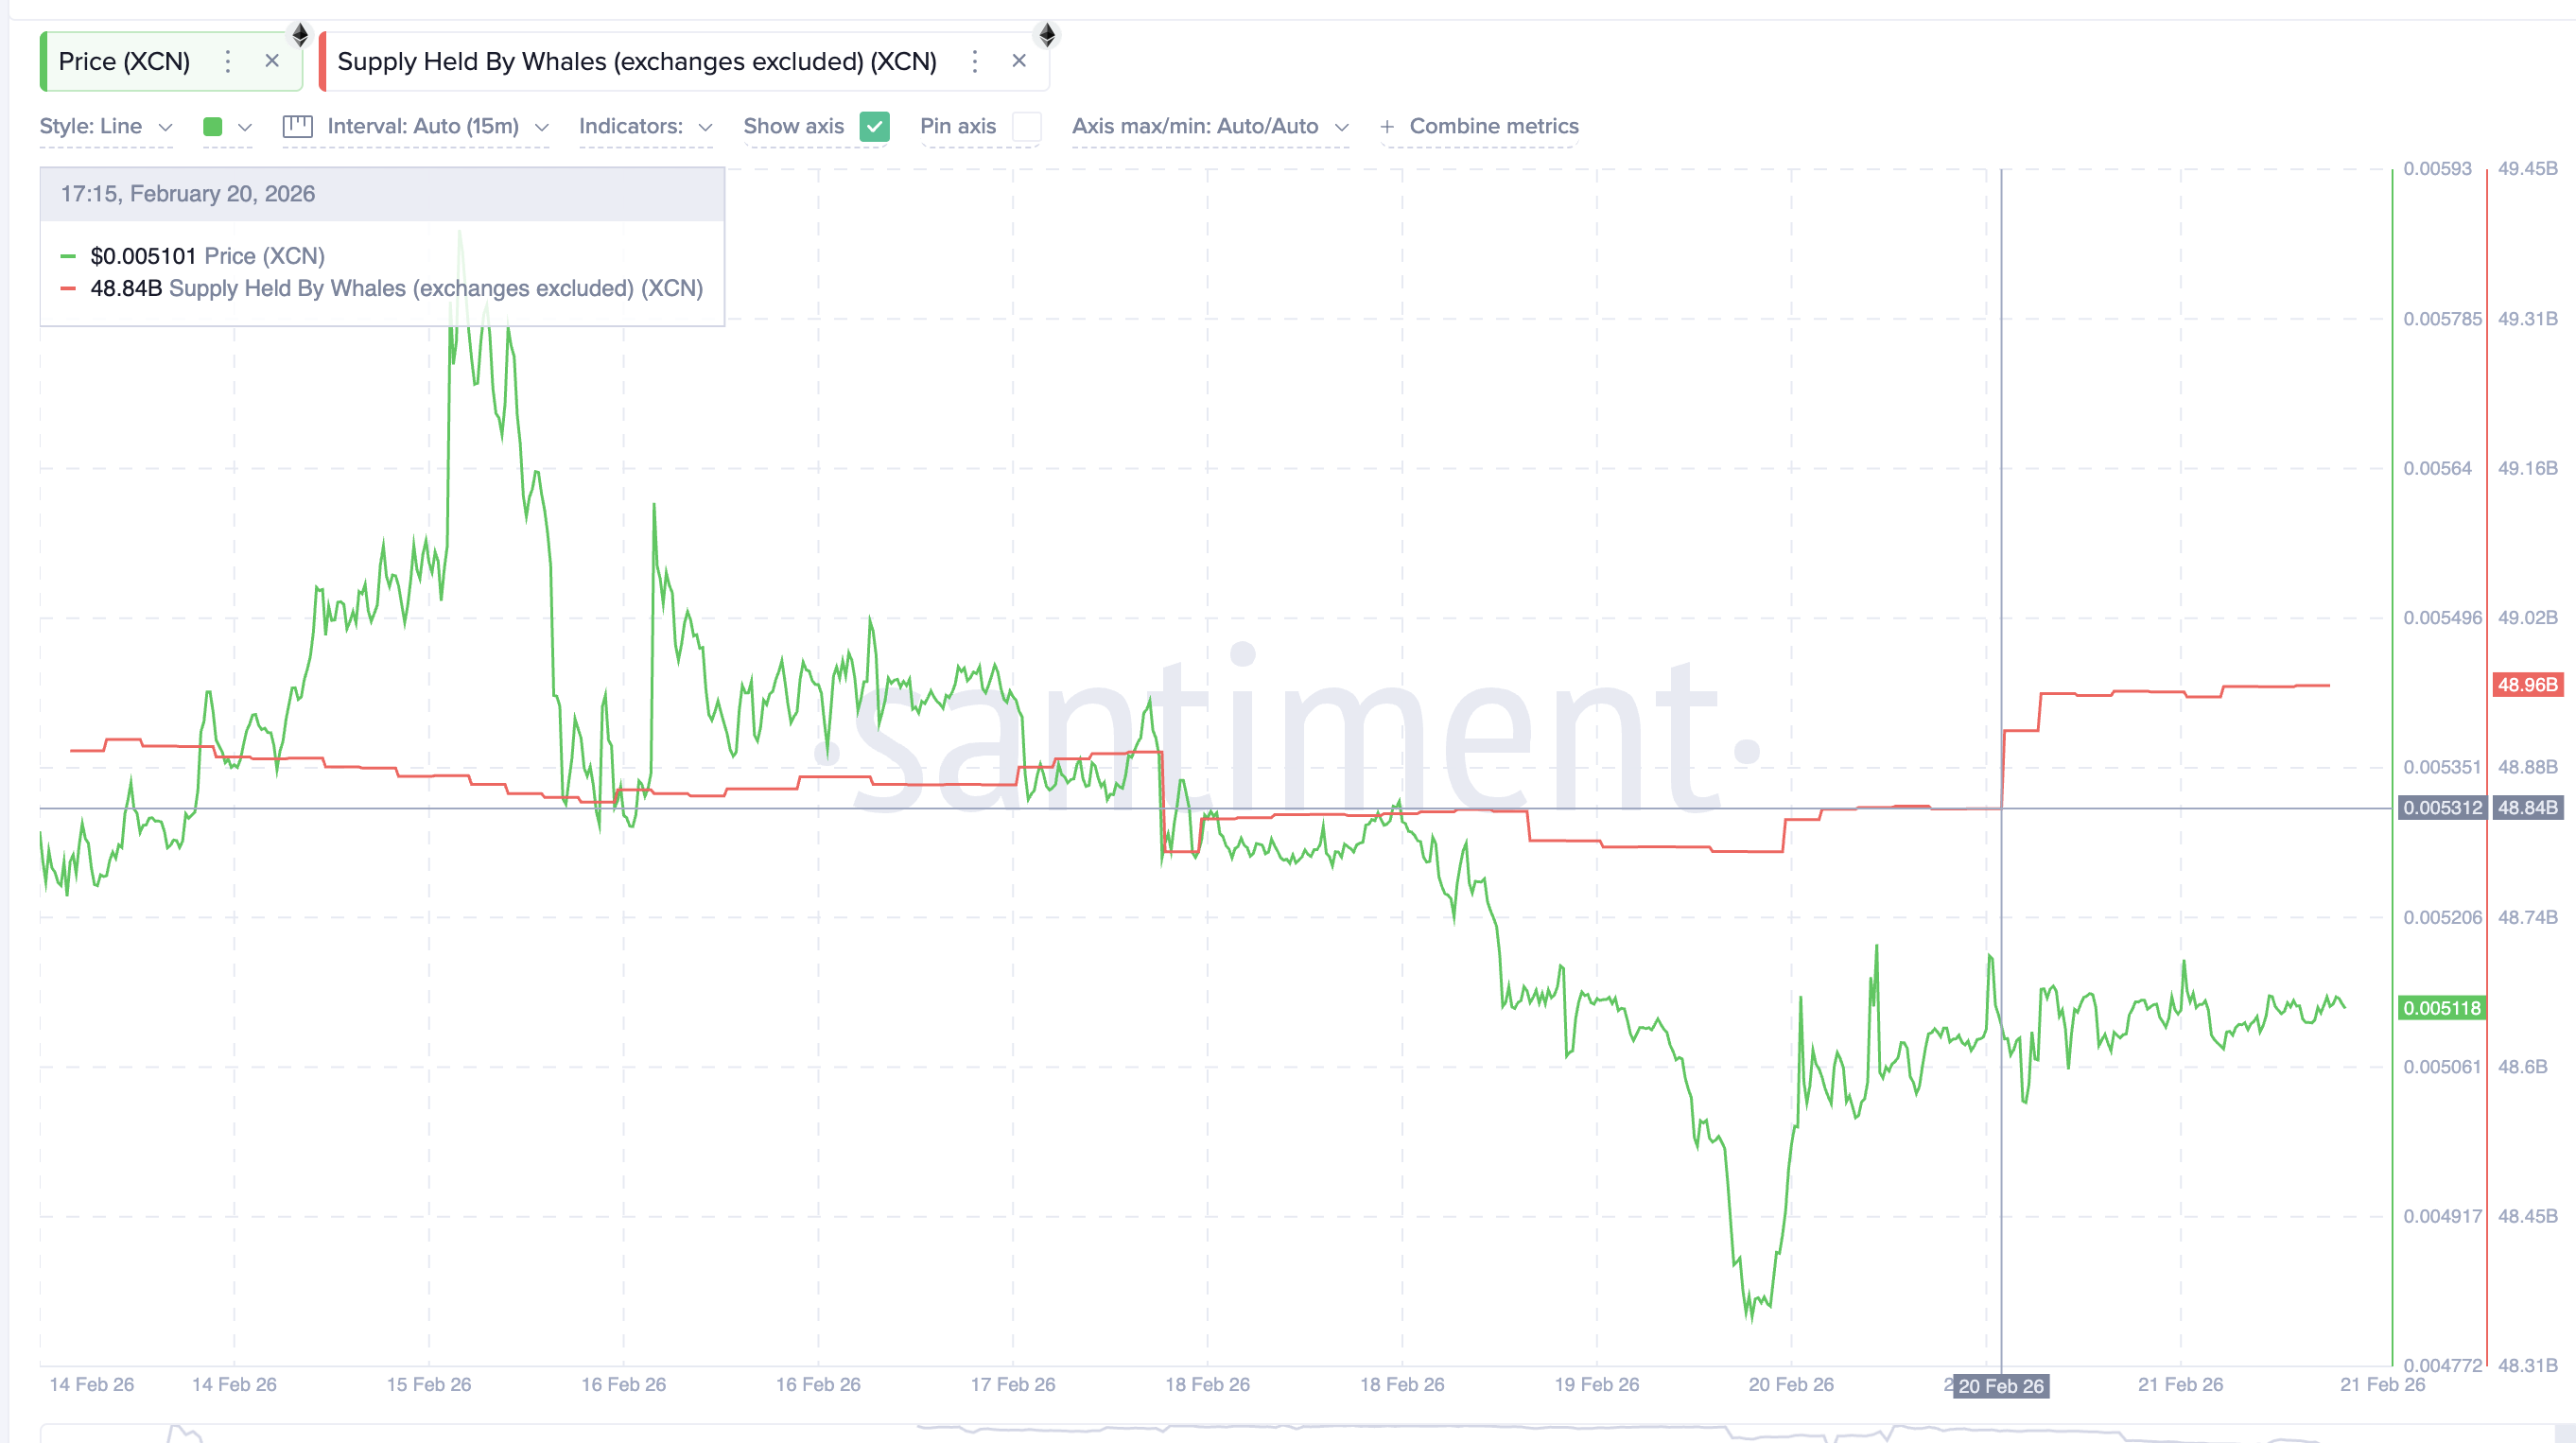 Onyxcoin Whales: Santiment
One possible reason lies in Onyxcoin’s core role. The project focuses on blockchain-based financial infrastructure, including payments and settlement systems. If tariff restrictions ease and global trade improves, demand for blockchain settlement networks could rise. Whales may see XCN as a leveraged bet on that long-term macro shift.
The XCN price chart also supports this early positioning. Between November 4 and February 19, XCN formed a lower low in price, while the Relative Strength Index (RSI) formed a higher low.
RSI measures momentum. When RSI rises while price falls, it signals that selling pressure is weakening. This pattern often appears before a trend reversal. Importantly, the earlier RSI low was deep in the oversold zone, which strengthens the reversal signal.
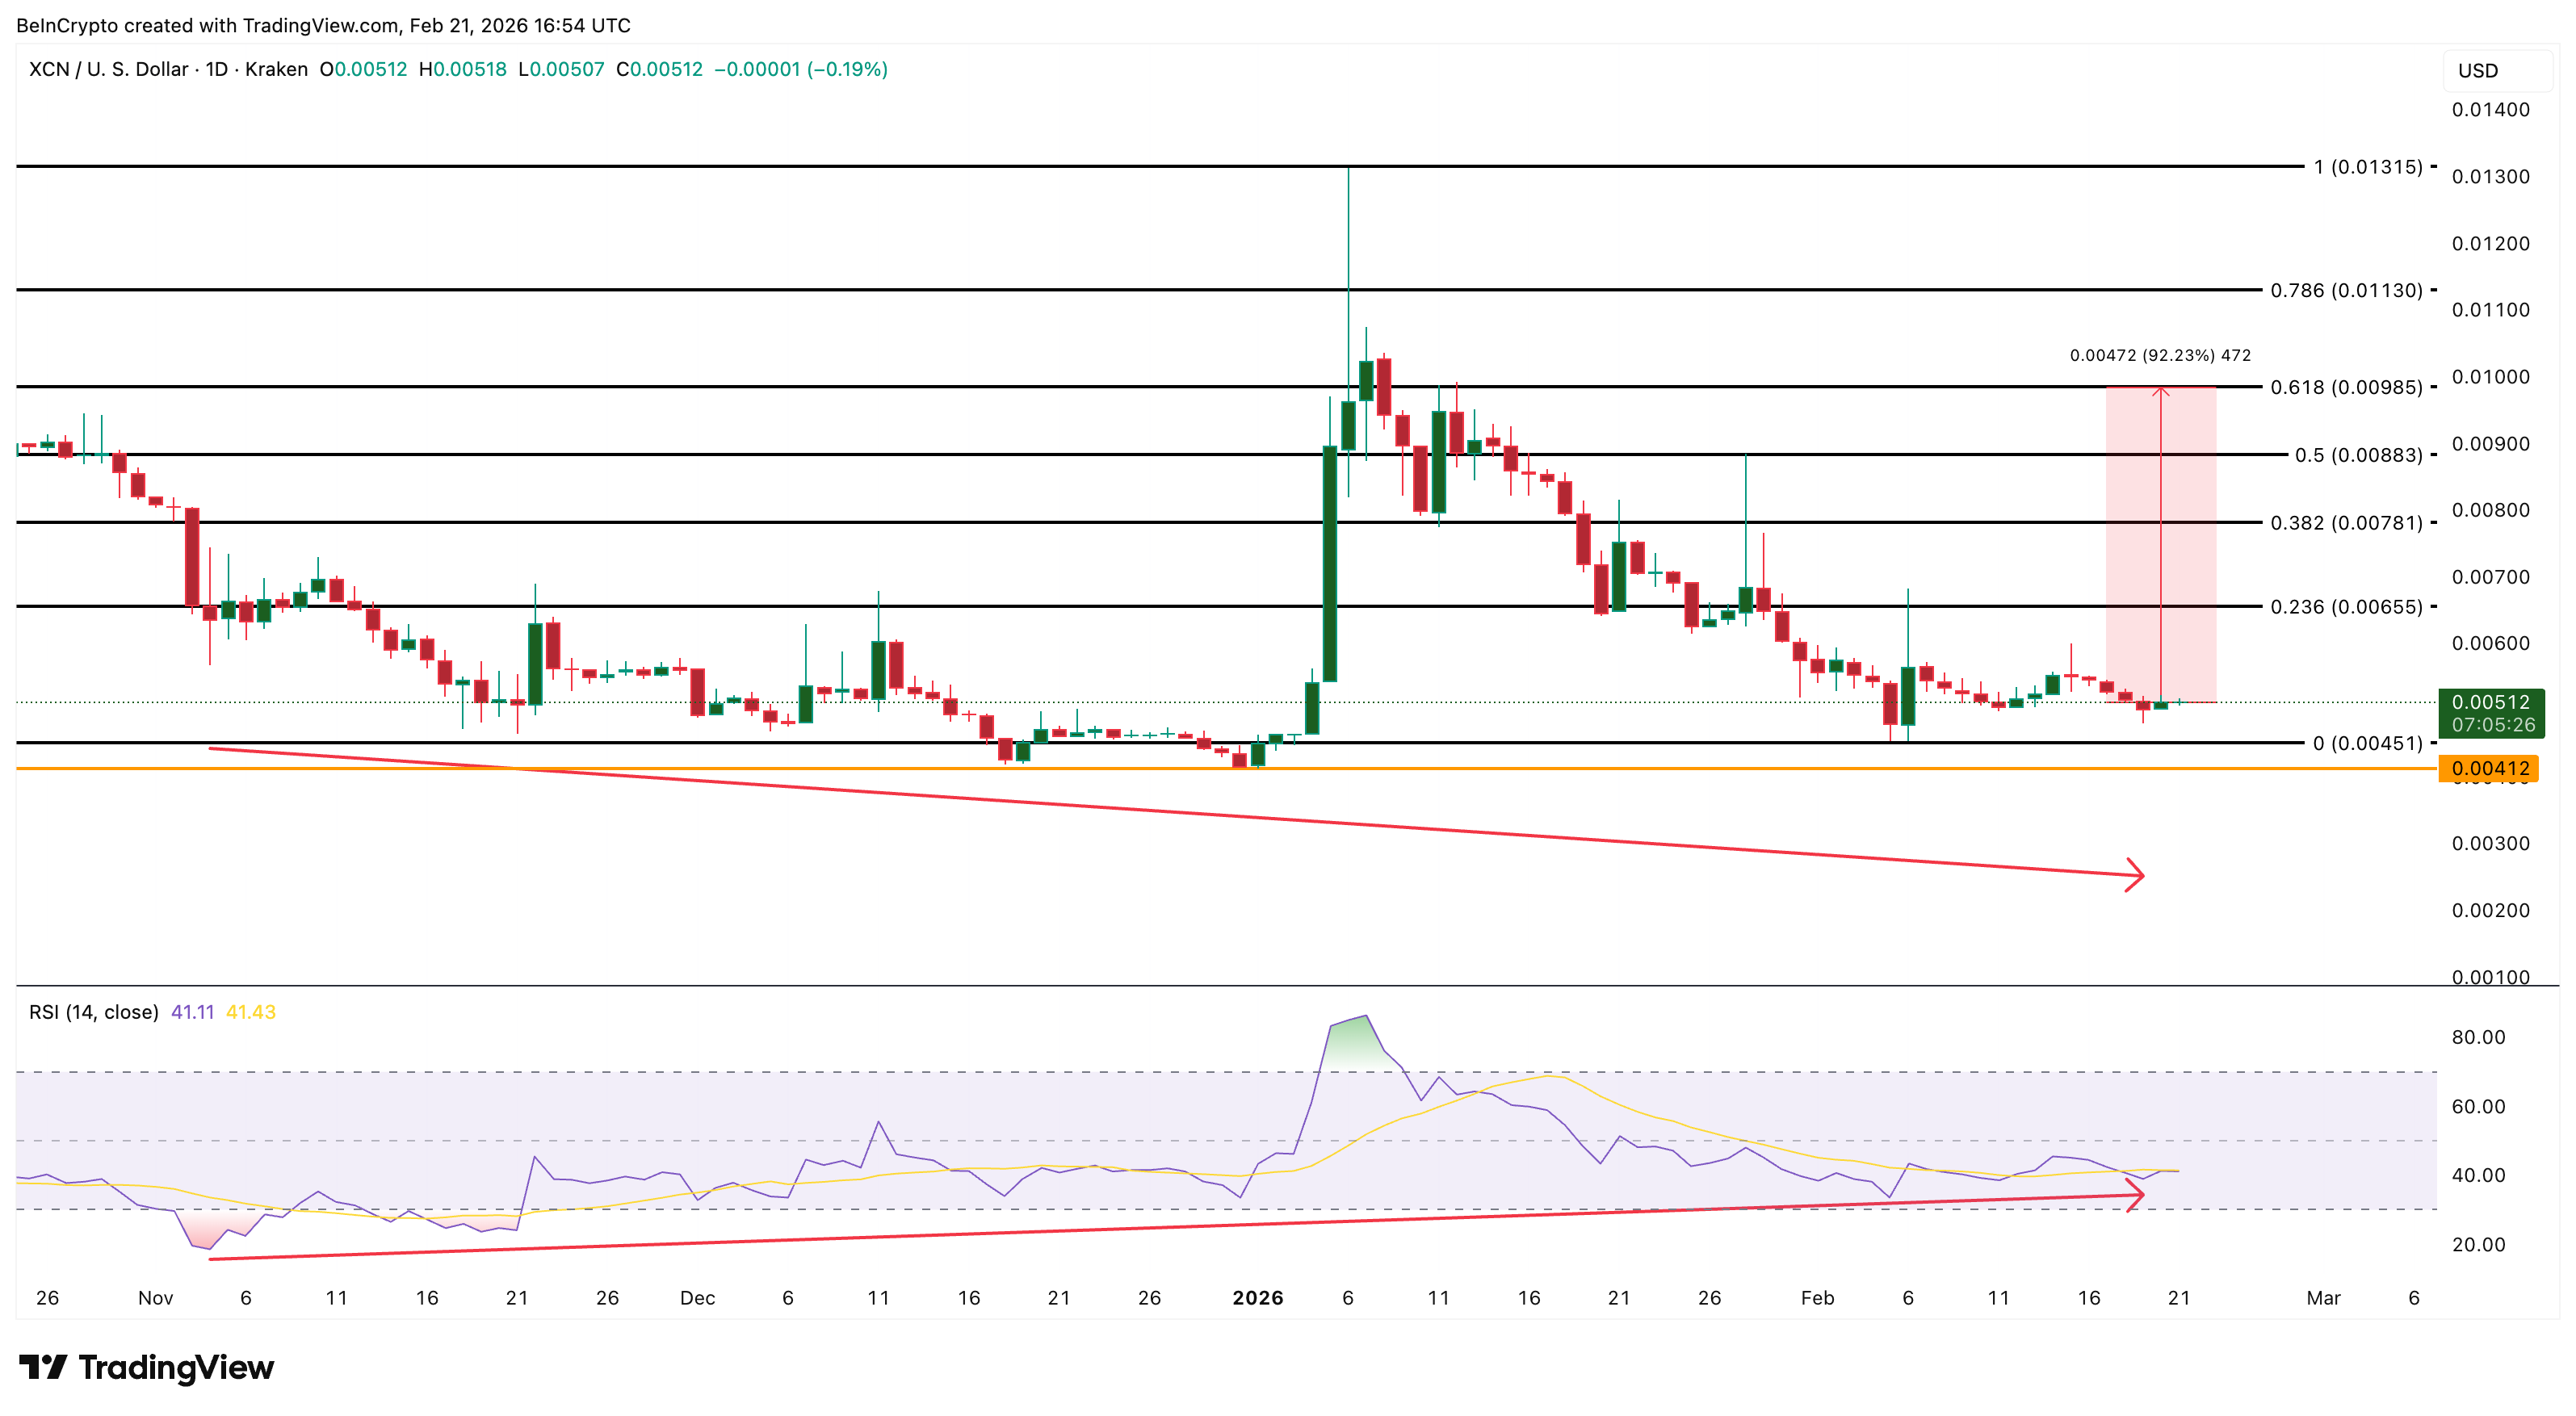 XCN Price Analysis: TradingView
Some recovery has already started. The next key breakout level sits at $0.0065. If XCN moves above this level, it could target $0.0098, which aligns with a key Fibonacci retracement level. This would represent a potential 92% rally from current levels.
However, risks remain. If XCN falls below $0.0045, the reversal structure weakens. A deeper drop toward $0.0041 could follow.
Ayrıca Şunları da Beğenebilirsiniz

the “ambient gambling” shift coming to brokerage accounts

Franklin Templeton CEO Dismisses 50bps Rate Cut Ahead FOMC
