This Crypto Expert Predicts Where The PIPPIN Price Is Headed Next
The PIPPIN price is once again among the top crypto gainers today, posting a sharp 20% rally and trading just slightly below the $0.60 level. After weeks of choppy consolidation, bulls have stepped back in with force, pushing the token into a key technical decision zone.
Now, one analyst believes the next move could define whether PIPPIN extends the breakout or faces another pullback.
Crypto_Jobs TA & FA recently shared a detailed breakdown on X, highlighting both the bullish structure and the critical resistance standing in the way.
Strong Daily Structure, But Resistance Overhead
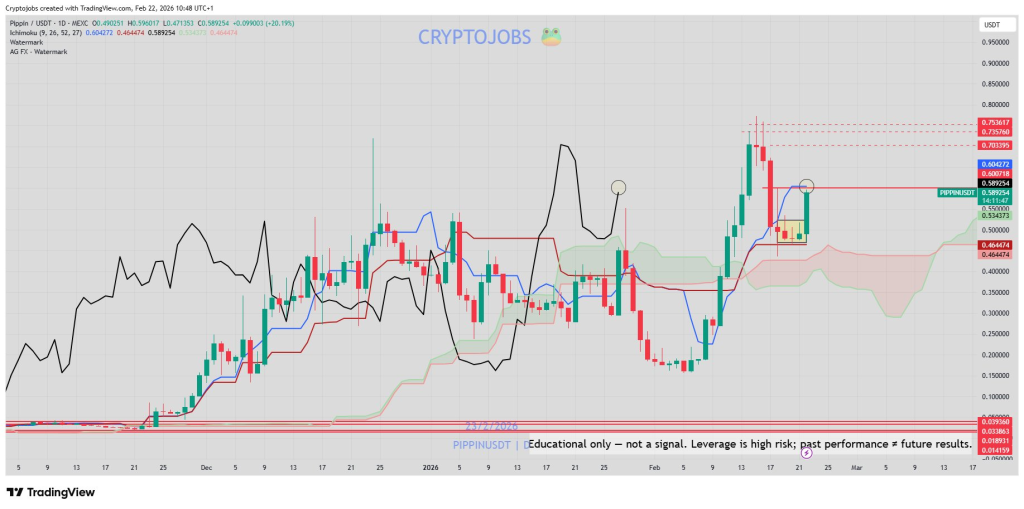
On the daily chart shared by the analyst, PIPPIN has reclaimed momentum after bouncing from the $0.46–$0.47 region. That level, which aligns with previous support and structure, remains a key invalidation zone for bulls.
The analyst points out that the broader daily structure still looks solid. Higher lows have formed after the recent dip, and price is holding above $0.0465 on a daily closing basis. As long as that level holds, bulls remain in control of the bigger picture.
However, price is now approaching a major resistance cluster.
The $0.0595–$0.0600 zone marks the 50% Fibonacci retracement level, and it has already acted as a ceiling. On the chart, multiple rejections are visible near that region. A clean break above it could open the door for another leg higher.
PIPPIN Chart: The $0.0600 Breakout Level
According to the analyst, a strong breakout above $0.0600 would likely trigger a 20%+ move toward the $0.0700 area and beyond.
 Source: X/@CryptoJobs3
The daily chart also shows the Tenkan-sen level from the Ichimoku indicator sitting around $0.0605. A daily close above that line would confirm renewed bullish momentum and strengthen the breakout case.
Right now, PIPPIN is pressing directly into that resistance band. The recent 20% pump brought price into the exact level traders were watching. This is where momentum either accelerates or stalls.
If bulls manage to flip $0.0600 into support, the next technical targets sit near $0.0703 and $0.0753, which are marked as prior supply zones on the chart.
The 4-Hour Setup: Consolidation Before Expansion?
The shorter timeframe chart provides more context.
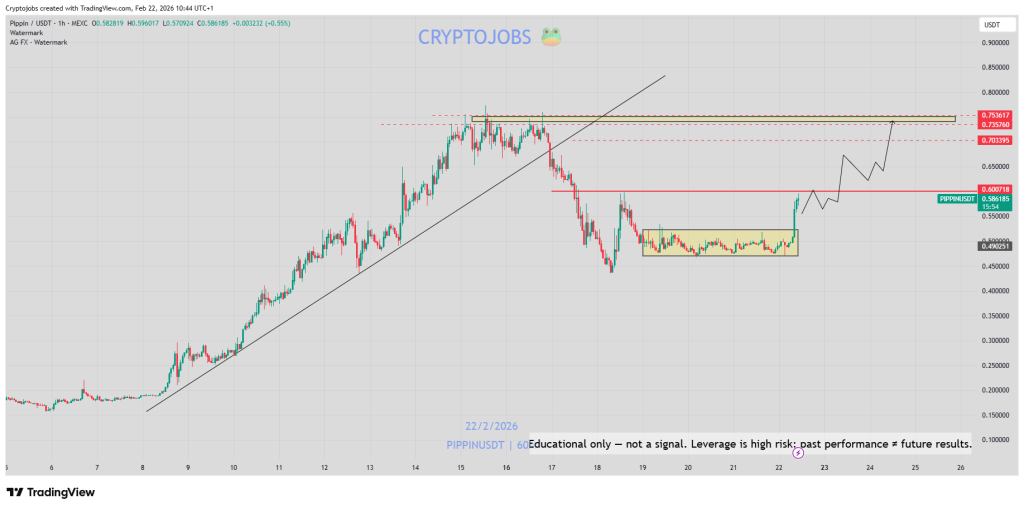
After a strong impulsive rally earlier in the month, PIPPIN corrected sharply before forming a tight consolidation range around the $0.49–$0.52 region. That boxed accumulation zone is clearly highlighted on the chart.
The breakout from that consolidation structure fueled the latest push higher. Now price is attempting to reclaim the $0.60 region, which also aligns with previous horizontal resistance.
 Source: X/@CryptoJobs3
The analyst’s projected path shows a potential breakout, followed by a retest of the $0.60 area as support before continuation toward $0.70+.
This type of breakout-and-retest pattern is common in strong momentum phases. It allows the market to confirm support before expanding higher.
What Happens If It Fails?
The bullish outlook depends on clean follow-through above $0.0600.
If price gets rejected again and closes back below resistance, the analyst warns that another dump could be on the horizon. In that scenario, the $0.0465 daily support becomes critical.
A breakdown below that level would damage the current bullish structure and potentially trigger deeper downside.
For now, though, the structure favors buyers. Higher lows remain intact, and the breakout attempt is happening on strong momentum.
PIPPIN Price: Key Levels To Watch
The battle lines are clear.
Resistance: $0.0595–$0.0605
Breakout target: $0.0700+
Major support: $0.0465
With PIPPIN already up 20% and testing resistance, the next daily close could be decisive. A confirmed breakout may unleash another wave of buying pressure.
For now, bulls have the momentum. The question is whether they can push through the ceiling and turn resistance into fuel for the next leg higher.
Subscribe to our YouTube channel for daily crypto updates, market insights, and expert analysis.
The post This Crypto Expert Predicts Where The PIPPIN Price Is Headed Next appeared first on CaptainAltcoin.
Ayrıca Şunları da Beğenebilirsiniz
Pippin (PIPPIN) Price Prediction 2026–2030: Can PIPPIN Hit $0.70 Soon?

Wormhole’s W token enters ‘value accrual’ phase with strategic reserve