

Dogecoin (DOGE) Slips Toward Critical Support, Breakdown Threat Emerges
Dogecoin started a recovery wave above the $0.0925 zone against the US Dollar. DOGE is now facing hurdles near $0.0970 and might struggle to continue higher.
- DOGE price started a recovery wave from $0.0880 and climbed above $0.0950.
- The price is trading below the $0.0955 level and the 100-hourly simple moving average.
- There is a contracting triangle forming with support at $0.0920 on the hourly chart of the DOGE/USD pair (data source from Kraken).
- The price could continue to move up if it stays above $0.090.
Dogecoin Price Hits Resistance
Dogecoin price started a recovery wave from the $0.0880 zone, like Bitcoin and Ethereum. DOGE climbed above the $0.090 and $0.0920 resistance levels.
There was a decent upward move toward the 50% Fib retracement level of the downward move from the $0.1061 swing high to the $0.0877 low. However, the bears remained active near the $0.0970 zone. Besides, there is a contracting triangle forming with support at $0.0920 on the hourly chart of the DOGE/USD pair.
Dogecoin price is now trading below the $0.0955 level and the 100-hourly simple moving average. If there is another recovery wave, immediate resistance on the upside is near the $0.0970 level.
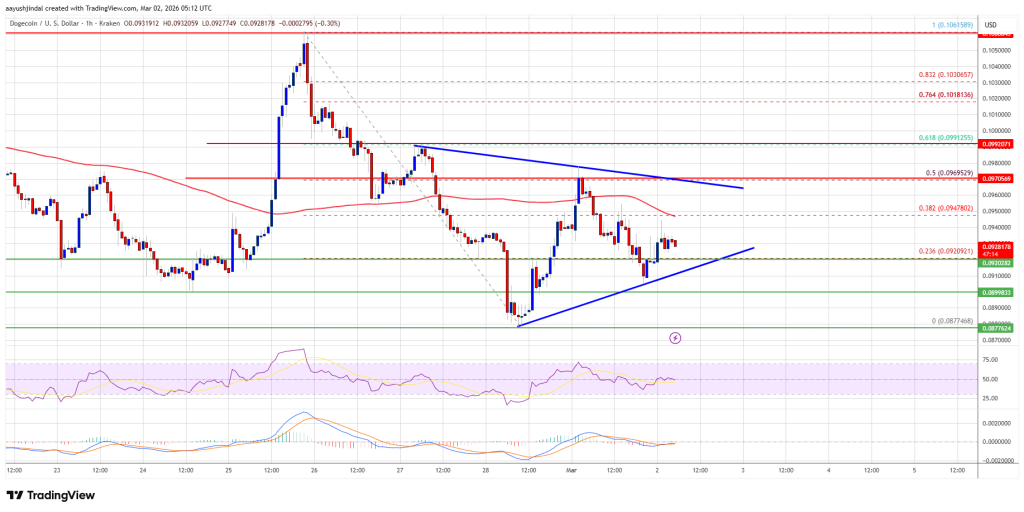
The first major resistance for the bulls could be near the $0.0990 level or the 61.8% Fib retracement level of the downward move from the $0.1061 swing high to the $0.0877 low. The next major resistance is near the $0.1020 level. A close above the $0.1020 resistance might send the price toward the $0.1085 resistance. Any more gains might send the price toward the $0.1120 level. The next major stop for the bulls might be $0.1150.
Another Decline In DOGE?
If DOGE’s price fails to climb above the $0.0970 level, it could continue to move down. Initial support on the downside is near the $0.0920 level. The next major support is near the $0.090 level.
The main support sits at $0.0875. If there is a downside break below the $0.0875 support, the price could decline further. In the stated case, the price might slide toward the $0.0820 level or even $0.0800 in the near term.
Technical Indicators
Hourly MACD – The MACD for DOGE/USD is now losing momentum in the bullish zone.
Hourly RSI (Relative Strength Index) – The RSI for DOGE/USD is now below the 50 level.
Major Support Levels – $0.0920 and $0.0900.
Major Resistance Levels – $0.0970 and $0.0990.
Ayrıca Şunları da Beğenebilirsiniz

Polymarket Prices 86% Odds Of Sub-$80 – Will $83 Break?

Markets await Fed’s first 2025 cut, experts bet “this bull market is not even close to over”
