

How Crypto Trading Changed in Two Years
CoinGecko’s 2026 CEX and DEX Trading Report covering January 2025 through February 2026 shows DEX spot market share doubling from 6.9% to 13.6%, perp DEX volume growing 8x from $81.7 billion to $739.5 billion, and crypto exchanges recording over $2.4 billion in hack-related losses during the period.
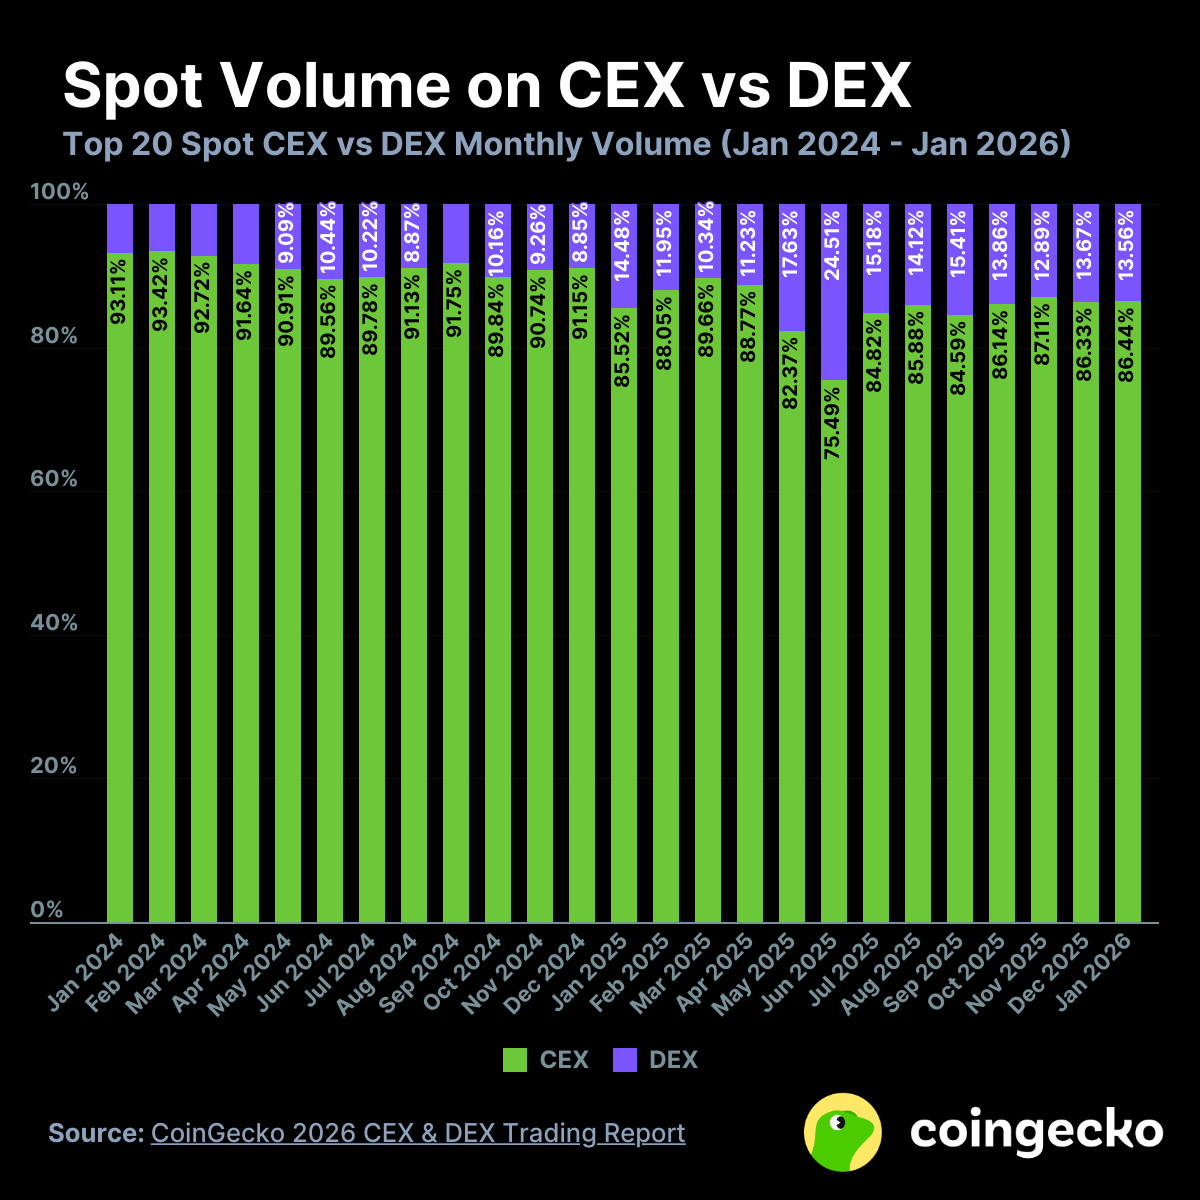
Spot Trading: CEX Still Dominates, DEX Is Growing Fast
CEXs maintained over $1 trillion in monthly spot volume throughout the period. That dominance is not in question. What the data shows is the direction of travel on the margins.
 Source: https://x.com/coingecko/status/2028772446443339916
DEX spot share started at 6.9% in January 2024. It reached 13.6% by January 2026. It peaked at 24.5% during a period when Binance Alpha 2.0 was routing trades through PancakeSwap, temporarily inflating DEX numbers before normalizing. The underlying trend, excluding that spike, is a steady doubling over two years.
PancakeSwap and Uniswap both broke into the top 10 spot exchanges by six-month volume for the first time, with $0.55 trillion and $0.54 trillion respectively. They sit at the bottom of the top 10, tied with KuCoin at 6.1% share each. Binance remains at 39.6%, more than four times the next-largest exchange MEXC at 8.2%. The CEX concentration at the top is unchanged. The new entries at the bottom of the top 10 are the DEX story.
Perpetuals: The DEX Breakout
The perps data is more dramatic. Combined perpetuals volume grew from $4.14 trillion in January 2024 to $7.24 trillion in January 2026, a 75% increase in two years. Perp DEX volume specifically grew 8x, from $81.7 billion to $739.5 billion. DEX share of total perps volume went from 2.0% to 10.2%.
Hyperliquid is the reason. It is the only DEX in the top 10 perps exchanges, recording $1.59 trillion in six-month volume and holding a 3.3% share of the total perps market. Binance leads perps at 27.8%, followed by OKX at 11.9% and MEXC at 11.8%. Hyperliquid at 3.3% is not competing with Binance perps. It is competing with mid-tier CEX perps platforms, and on volume it has already passed several of them.
The Hyperliquid fee dominance in the 24-hour fee chart covered earlier today is the current expression of this trend. When markets are volatile, perp DEX fees spike because perp DEX revenue is directly tied to trading volume and position opening fees. $1.6 million in daily fees from a single DEX perps platform confirms the volume share data is translating into real protocol revenue.
Token Listings: The 0.01% Problem
CEXs listed approximately 100 tokens per month across the period. MEXC led with 1,281 cumulative listings over 13 months. Gate followed at 1,273. Toobit listed 392, Bitget 247, HTX 203. Binance listed 100 over the same period, a deliberate strategy of limiting listings to higher-quality projects rather than competing on volume.
Uniswap listed 13.69 million tokens in the same period. Pump.fun listed 5.01 million. CEX listings covered 0.01% of tokens created.
That gap is the structural reality of the on-chain token creation era. Millions of tokens are being created and traded on DEXs without CEX involvement. Most of them are worthless. The ones that are not, a small fraction of the 13+ million, eventually get CEX listings after demonstrating organic demand. The CEX listing is increasingly a lagging indicator of token success rather than the primary mechanism for distribution.
Hack Losses: $2.4 Billion
Exchanges recorded over $2.4 billion in hack-related losses between January 2025 and February 16, 2026.
CEXs accounted for over $2.0 billion of that, with 71% attributable to the Bybit hack in February 2025. Bybit alone lost $1.46 billion. Binance had $300 million attributed to the 10/10 crash event. Bitget lost $100 million, Nobitex $90 million, Phemex $80 million.
DEX exploits totaled $223 million for the largest single incident. Cetus lost $223 million through smart contract and oracle vulnerabilities. Balancer lost $128 million. GMX lost $42 million. Hyperliquid had $17 million in associated losses, though the footnote notes $12 million of that was unrealized losses from the JELLYJELLY exploit that were subsequently reversed. SwapNet lost $13.5 million.
The attack vector breakdown between CEXs and DEXs reflects fundamentally different security models. CEX hacks tend to be large, single events targeting custody infrastructure. DEX exploits tend to be smart contract vulnerabilities or oracle manipulation attacks. Both categories remain targets at scale.
The post How Crypto Trading Changed in Two Years appeared first on ETHNews.
Ayrıca Şunları da Beğenebilirsiniz

The Financial Action Task Force (FATF) has warned that stablecoins are becoming a primary tool for illicit transactions and called for stronger regulation of their issuers.

Trump Presses Congress as Stablecoin Tensions Escalate Between US Banks and Crypto Firms
