

Chainlink price confirms bearish SFP pattern as $8.33 support comes into focus
Chainlink price has confirmed a bearish swing failure pattern at a key resistance zone, signaling a potential downside rotation. The rejection near $9.72 increases the probability of a corrective move toward the $8.33 high-timeframe support.
- Bearish SFP confirmed: Rejection at the $9.72 resistance signals weakening bullish momentum.
- Value Area High lost: Indicates a shift in market structure toward downside pressure.
- $8.33 support in focus: Confluence with value area low makes it the next major downside target.
Chainlink (LINK) price is showing clear signs of technical weakness after failing to sustain momentum above a critical resistance level. Recent price action formed a bearish swing failure pattern (SFP) at the $9.72 high-timeframe resistance, a signal that often indicates exhaustion in bullish momentum.
With this rejection now confirmed, traders are closely watching the $8.33 region as the next significant support level.
Chainlink price key technical points
- High-timeframe resistance rejection: Price rejected the $9.72 resistance with a bearish SFP formation.
- Value Area High lost: Loss of this key level signals weakening bullish momentum.
- Downside target: $8.33 aligns with the value area low and major high-timeframe support.
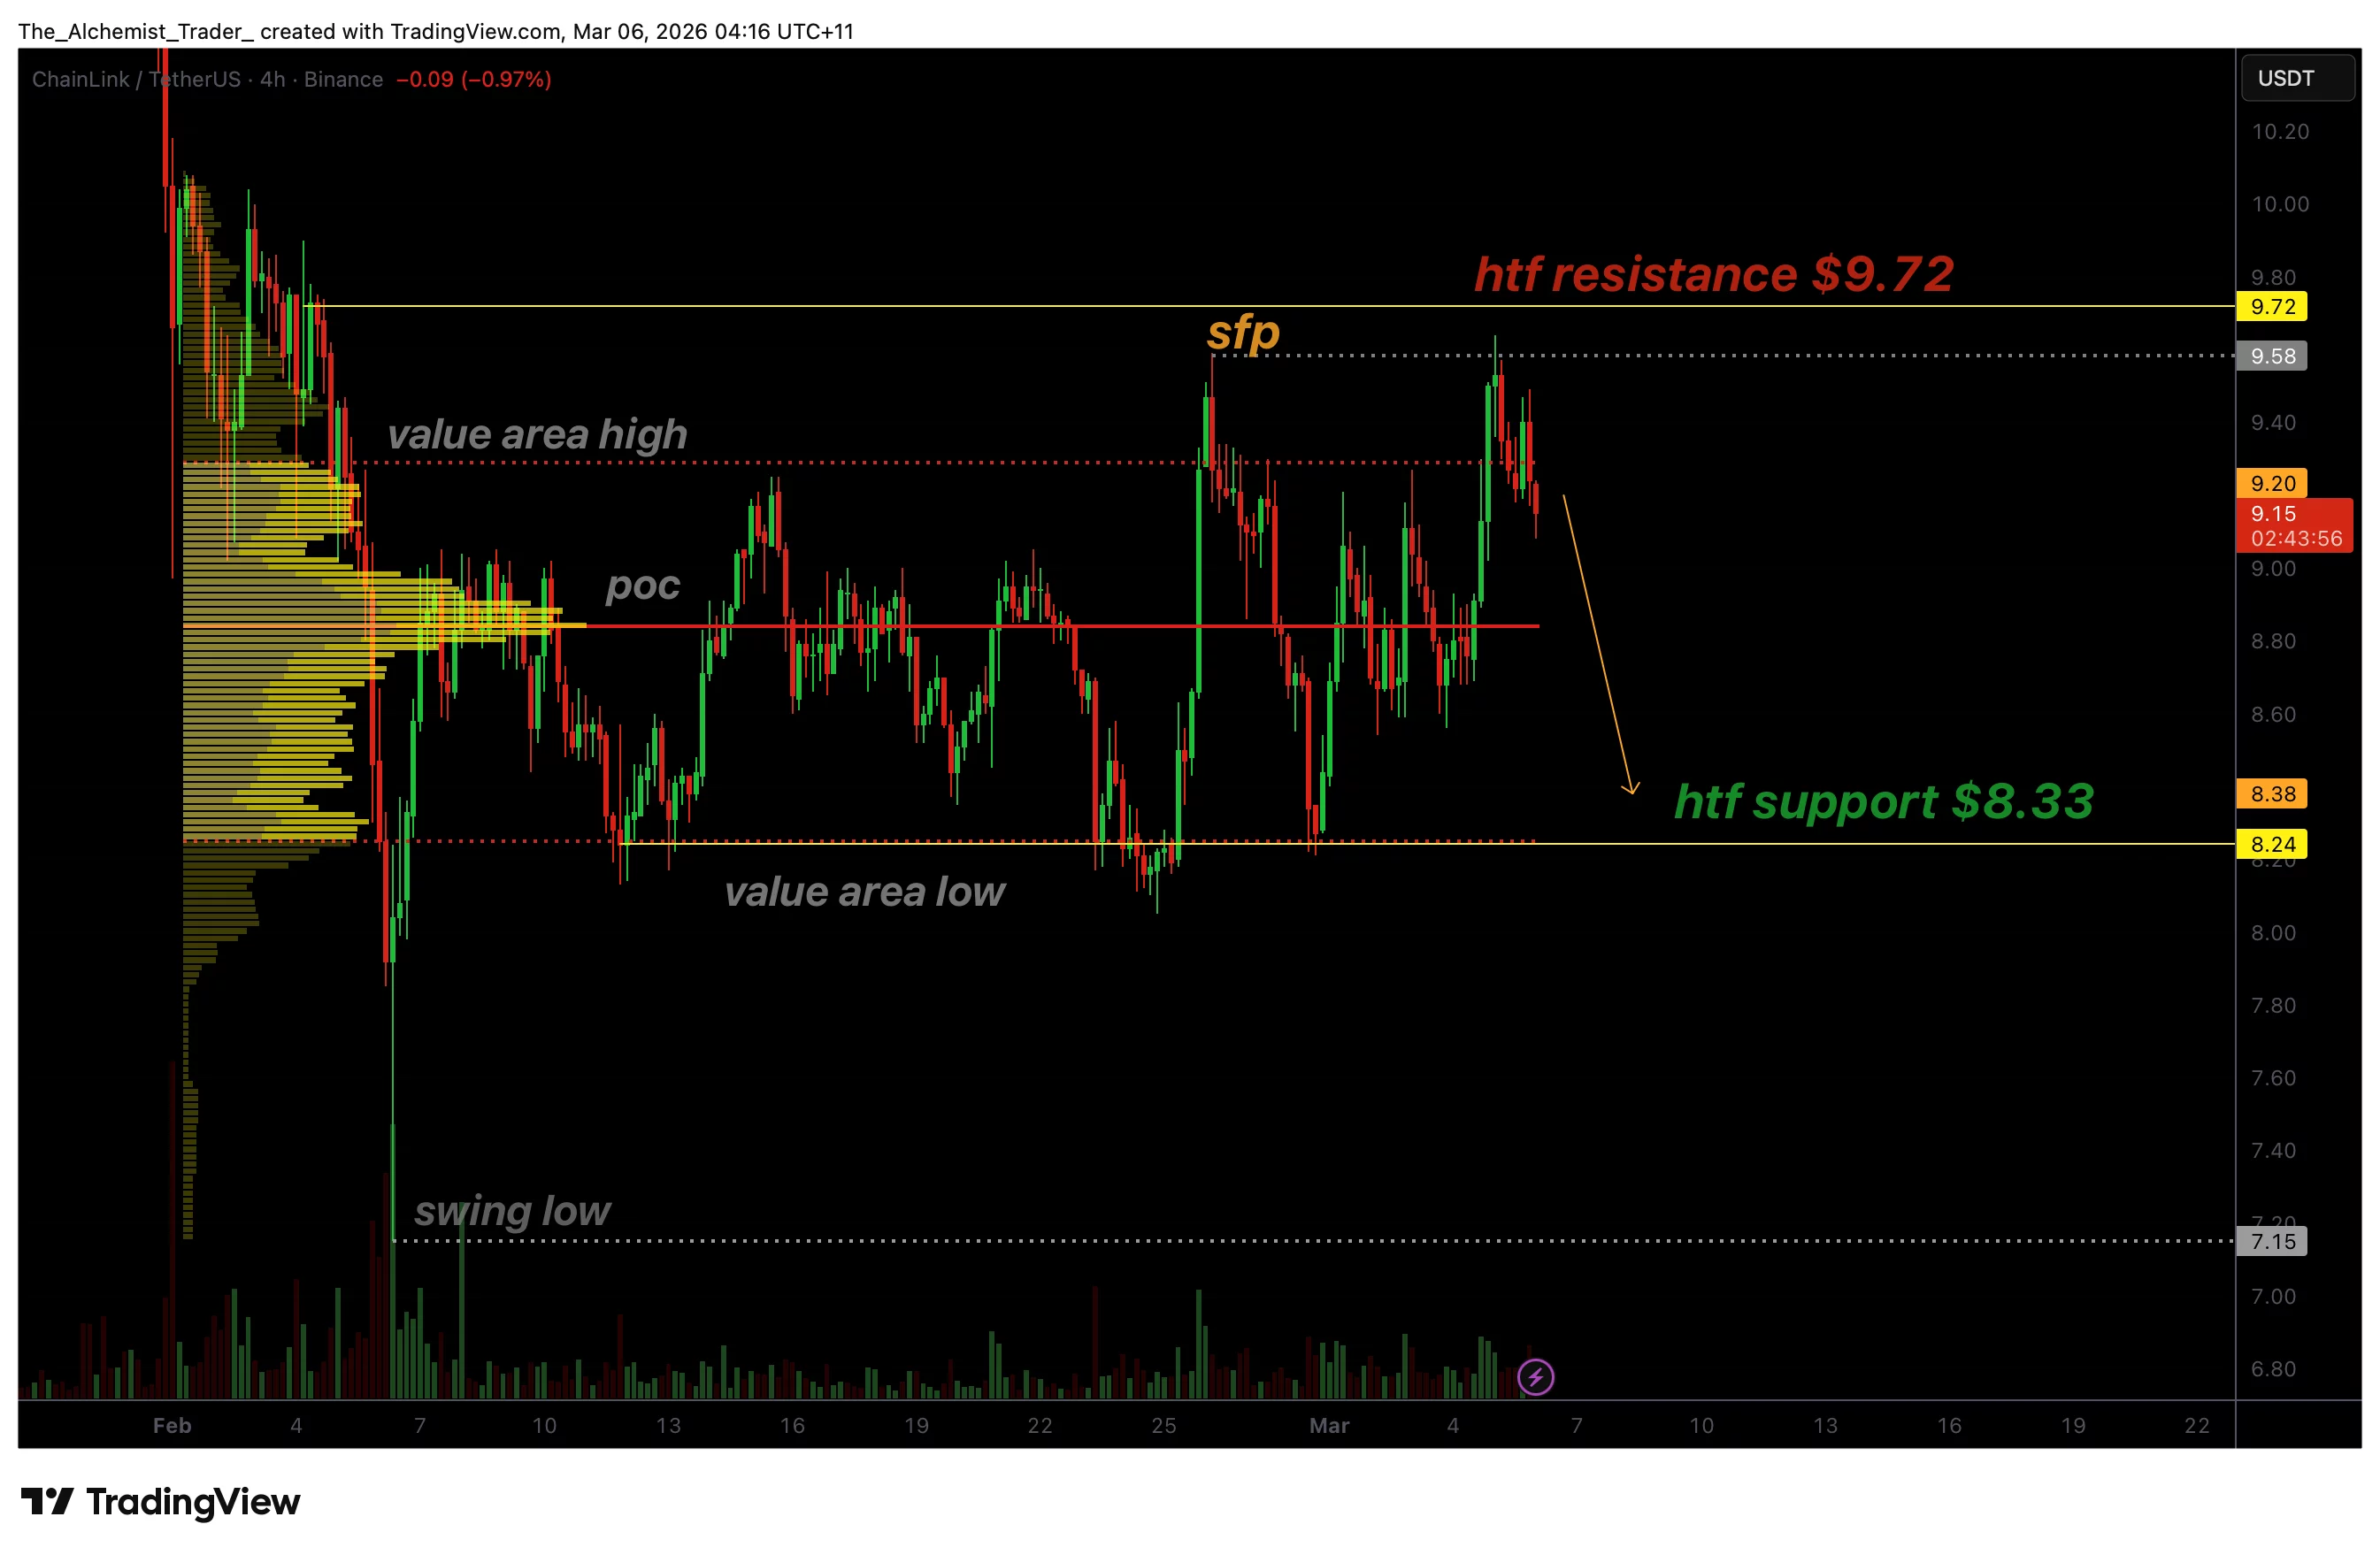
Chainlink recently attempted to break above the $9.72 resistance level, which has historically acted as a major barrier in price action. However, the breakout attempt was short-lived. The market briefly traded above the previous swing high but quickly reversed, leaving a wick above the level before closing back below it. This structure forms a classic swing failure pattern, which is widely recognized by traders as a signal that liquidity above the highs has been taken before the market rotates lower.
The confirmation of this SFP highlights a shift in short-term market control. When price fails to sustain above a key resistance and closes back within the previous range, it often indicates that buyers have lost momentum. In Chainlink’s case, the inability to hold above $9.72 suggests that the move was primarily driven by liquidity collection rather than genuine bullish continuation. This increases the probability of a retracement as the market seeks lower levels of support.
Another important technical development is the loss of the value area high. This level previously acted as a key pivot within the current trading range, providing support during earlier pullbacks. Once price loses this level, it often signals a structural shift where sellers begin to gain greater control of the market.
The breakdown from this region reinforces the bearish outlook and suggests that Chainlink may continue rotating within the broader range. On the regulatory front, Chainlink’s deputy general counsel, Taylor Lindman, has also joined the Securities and Exchange Commission’s Crypto Task Force, stepping in to replace Michael Selig.
The next major level of interest is the point of control, which represents the price level with the highest traded volume within the range. This area typically acts as a magnet for price due to the high concentration of market activity. If Chainlink continues to show weakness and fails to reclaim the value area high, price is likely to gravitate toward this zone as traders reposition within the range structure.
Below the point of control lies the value area low, which sits in direct confluence with the $8.33 high-timeframe support level. This region represents a critical area where buyers may attempt to step in and defend price. Historically, high-timeframe supports combined with volume-profile levels tend to attract significant market interest, making $8.33 an important level to monitor in the coming sessions.
Meanwhile, on the fundamental side, Chainlink has recently enabled Coinbase’s cbBTC bridging to Monad, unlocking over $5 billion in Bitcoin-backed liquidity for decentralized finance applications and further expanding its ecosystem utility.
While short-term bounces can occur during corrective phases, the broader structure currently favors downside continuation. As long as price remains below the rejected resistance at $9.72 and fails to reclaim the value area high, the bearish market structure remains intact. This keeps the probability tilted toward a deeper rotation within the current range.
What to expect in the coming price action
From a technical and structural perspective, Chainlink remains under bearish pressure following the confirmed SFP rejection at $9.72. If the value area high continues to act as resistance, price is likely to rotate lower toward the $8.33 support zone.
A strong reclaim of the lost resistance would invalidate the bearish outlook, but until then, the path of least resistance remains to the downside.


Ayrıca Şunları da Beğenebilirsiniz
Solana Decoupling From Crypto Market as Tokenized Stock Hype Intensifies
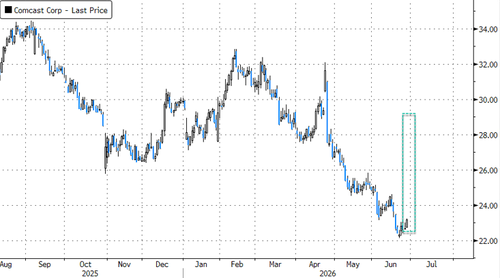
Comcast Shares Jump Most Since 2008 On Plans To Separate Units


