Bitcoin (BTC) Price: How BTC Has Outperformed Gold and the S&P 500 Since the War Began
TLDR
- Bitcoin dropped 8.5% when the U.S.-Iran war started but has since risen ~11% from its lowest point.
- Each new conflict escalation has triggered a sell-off, but Bitcoin keeps finding buyers at higher price levels.
- BTC has outperformed gold and the S&P 500 over the same two-week period.
- Large Bitcoin wallet holders (whales) are accumulating again near $71,000, now controlling 68.17% of total supply.
- On-chain data suggests little resistance between current prices and ~$82,000.
Bitcoin is currently trading at $71,500.
 Bitcoin (BTC) Price
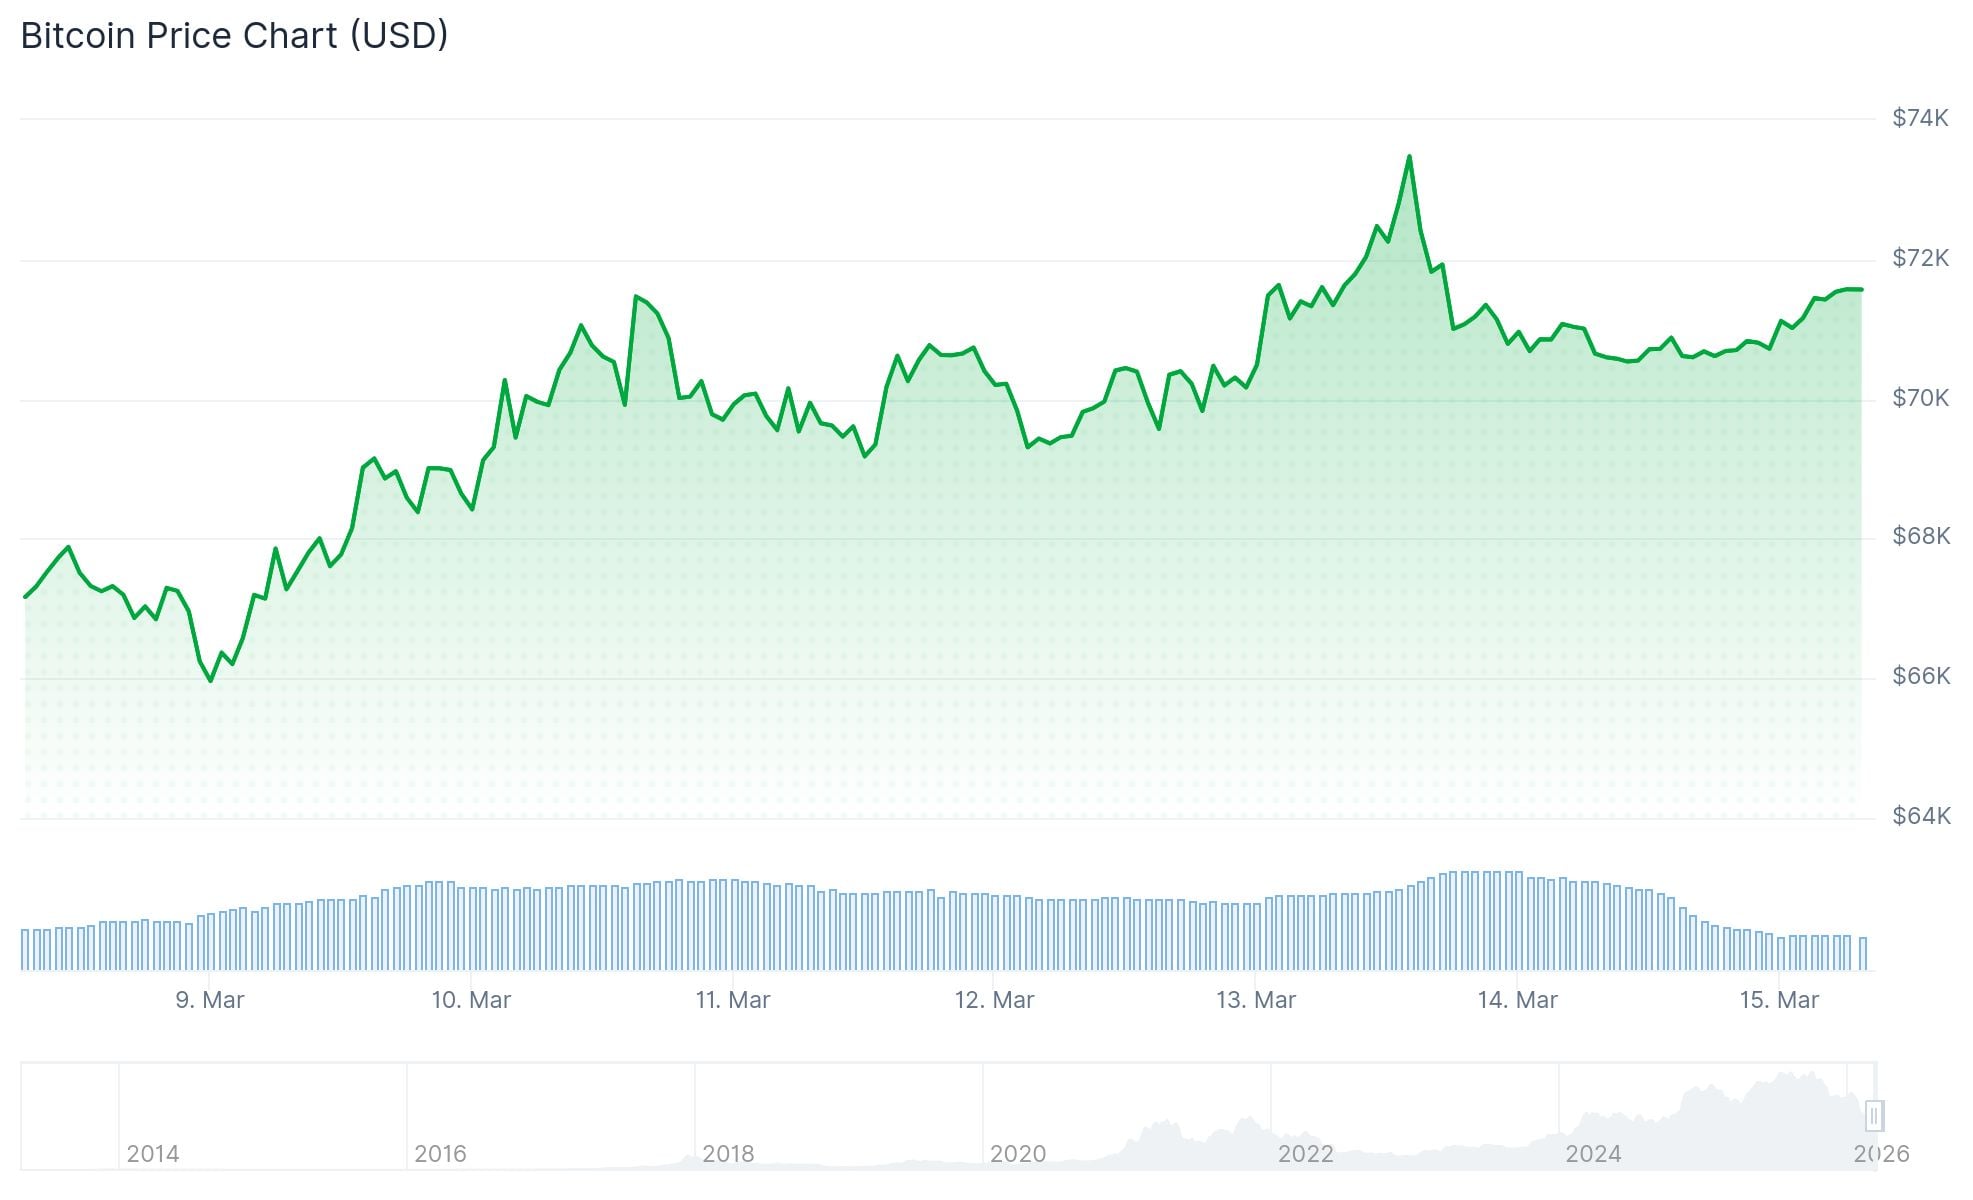
The U.S.-Iran war began on a Saturday, Feb. 28. Bitcoin was the only major market open that day. It dropped 8.5% to $64,000. That was its lowest point.
Two weeks later, the picture looks different.
Bitcoin has climbed roughly 11% from that low. It now trades around $71,500. Over the same stretch, gold has been volatile, the S&P 500 is down, and Asian equity markets had their worst week since 2020. Only oil — up over 40% — and the U.S. dollar have outperformed Bitcoin. Both are direct beneficiaries of the war.
A Rising Floor After Every Sell-Off
Every escalation since Feb. 28 has triggered a Bitcoin sell-off. But each time, buyers have stepped in at a higher level.
After Iran’s retaliatory missile strikes on March 2, the price bottomed at $66,000. After a week of sustained conflict on March 7, the floor was $68,000. Following tanker attacks on March 12, BTC held $69,400. After the Kharg Island strike on March 14, the low was $70,596.
That’s a rising support line of roughly $1,000–$2,000 per event.
At the same time, Bitcoin has been rejected four times near $73,000–$74,000. That ceiling has held firm. Something has to give — either Bitcoin breaks above $74,000, or a bigger escalation finally overwhelms buyers.
Earlier this year, a sudden liquidation event wiped $2.5 billion in leveraged positions over a single weekend, dragging Bitcoin to $77,000. That episode appears to have cleared out overleveraged positions, leaving a market that has since absorbed repeated war headlines without a similar collapse.
Whales Accumulating, On-Chain Data Points to $82K
Data from crypto analytics platform Santiment shows large Bitcoin wallets — those holding between 10 and 10,000 BTC — have started accumulating again near $71,000.
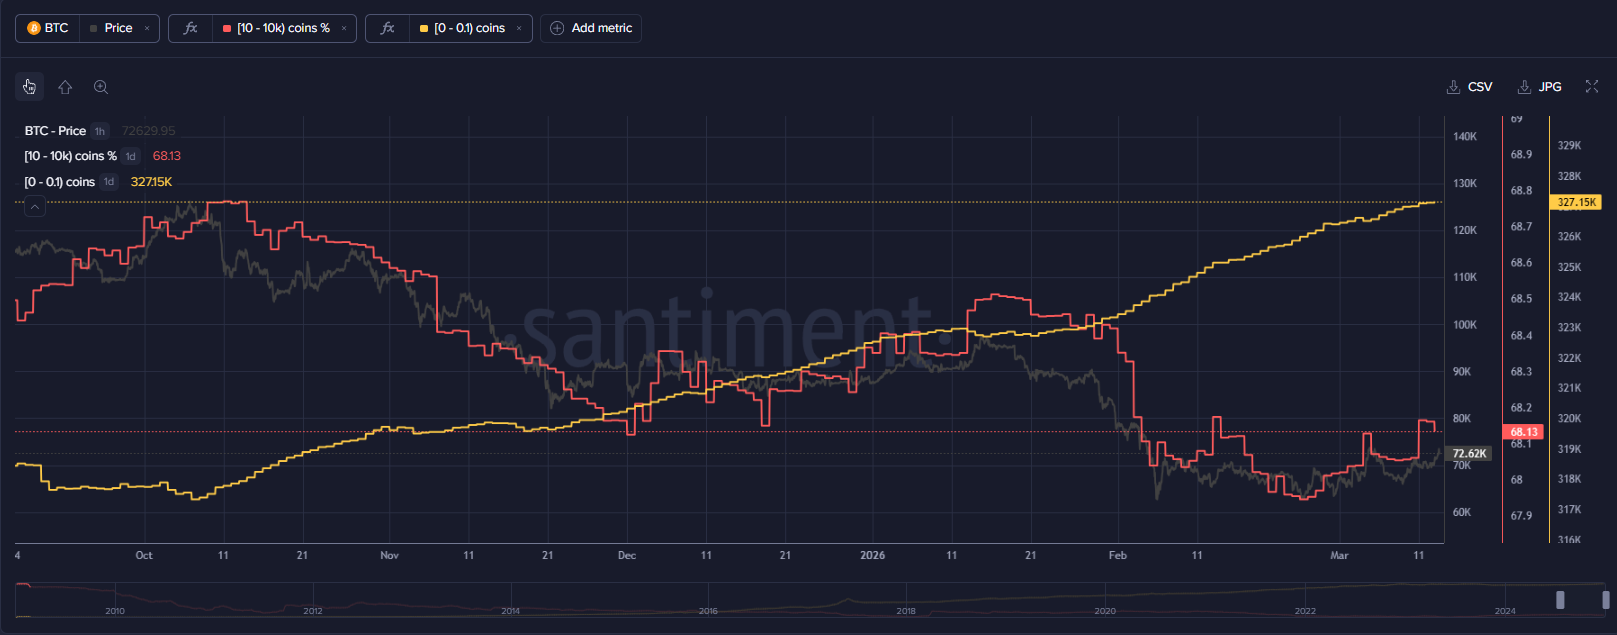 Source: Santiment
These wallets now control 68.17% of Bitcoin’s total supply, up from 68.07% a week ago. Santiment called the shift a “positive reversal.” The platform is watching to see if retail investors begin selling, which would historically signal a market bottom forming.
The Crypto Fear & Greed Index sat at 16 on Sunday — firmly in “Extreme Fear.”
U.S. spot Bitcoin ETFs logged their first five-day inflow streak of 2026 this week, pulling in approximately $767 million.
On-chain analyst Ali Martinez, citing the UTXO Realized Price Distribution metric, noted that Bitcoin currently faces very little resistance between current prices and roughly $82,045. The $74,000 rejection zone, he noted, has low investor cost-basis activity, suggesting it may not be as strong a barrier as it appears.
The next major support below current prices sits around $66,898.
Bitcoin is up 7.55% over the past 30 days. BTC is currently trading at $71,500.
The post Bitcoin (BTC) Price: How BTC Has Outperformed Gold and the S&P 500 Since the War Began appeared first on CoinCentral.
Ayrıca Şunları da Beğenebilirsiniz

South Korea And Japan Weigh Trump’s Critical Proposals

The Complete Guide to Choosing the Right Flooring Contractor for Durable and Stylish Floors