

U.S. Money Supply Hits $22.45T, Is Bitcoin Breakout Coming?

The post U.S. Money Supply Hits $22.45T, Is Bitcoin Breakout Coming? appeared first on Coinpedia Fintech News
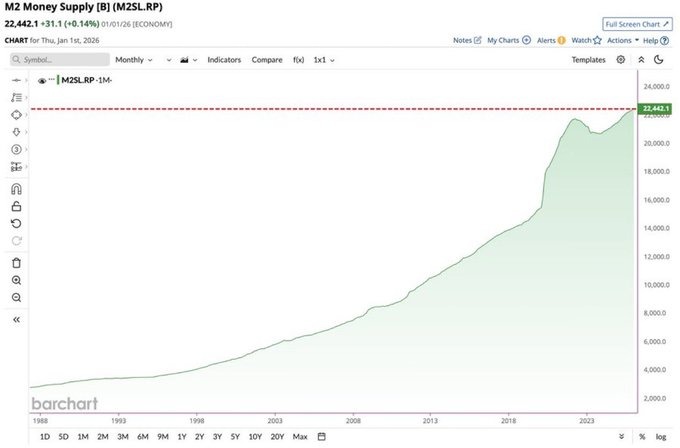
The U.S. M2 money supply has reached a new all-time high of $22.45 trillion, showing a steady rise in liquidity across the economy. Meanwhile, this is important for crypto markets, as rising liquidity has historically supported Bitcoin and other risk assets.
U.S. M2 Money Supply at Record $22.45T
Looking at the recent data, the U.S. M2 money supply has reached $22.45 trillion, rising about 4.3% year-over-year.
As seen in the chart, M2 has been on a long-term upward trend, with sharp growth after 2020 and now reaching fresh highs again. This shows that more money is circulating in the economy than ever before.
Historically, rising money supply has been a “risk-on” signal, meaning investors are more willing to take risks.
A clear example is the pandemic period, when M2 jumped from $15 trillion to $21 trillion. During the same time, Bitcoin saw its biggest rally, reaching $69,000 in November 2021.
Later, in late 2025, Bitcoin again surged to a new all-time high of around $124,000, supported by continued liquidity growth.
Why Rising Liquidity Supports Bitcoin Price
When liquidity increases, investors often move money into assets that can offer higher returns. This includes stocks, real estate, and especially cryptocurrencies like Bitcoin.
Bitcoin tends to benefit because it is seen as both:
- A risk asset during strong liquidity cycles
- A hedge when people worry about currency value
This is why past M2 growth phases have often matched with Bitcoin rallies.
- Also Read :
- The Biggest Crypto Regulatory Win in a Decade Failed to Boost Bitcoin – Why?
- ,
But This Cycle Looks Different
Despite M2 hitting a new high, Bitcoin has not followed the same pattern in early 2026.
Instead, the market has seen a 6-month phase of decline or sideways movement, even as liquidity continues to rise. This shows a more “decoupled” relationship compared to previous cycles.
One key reason is the growing presence of institutional investors. Unlike earlier cycles driven mostly by retail, today’s market is more mature and reacts differently to macro conditions.
At the same time, large Bitcoin holders are increasing their positions. While smaller investors remain cautious, whales are buying during dips.
If M2 continues to rise, it could act as fuel for the next crypto move. More liquidity means more buying power entering the market.
Never Miss a Beat in the Crypto World!
Stay ahead with breaking news, expert analysis, and real-time updates on the latest trends in Bitcoin, altcoins, DeFi, NFTs, and more.
FAQs
The U.S. M2 money supply has reached a new all-time high of $22.45 trillion, rising approximately 4.3% year-over-year, indicating record levels of liquidity circulating in the economy.
Historically, rising M2 money supply has acted as a risk-on signal, with liquidity flowing into assets like Bitcoin. Past M2 growth phases coincided with Bitcoin rallies to $69,000 in 2021 and $124,000 in 2025.
If M2 continues its upward trend, the growing liquidity could act as fuel for the next crypto move. However, market dynamics now include institutional factors that may delay the typical price response.
Ayrıca Şunları da Beğenebilirsiniz

Top 3 Altcoins for the Next Bull Run Ethereum, Solana and Mutuum Finance

Trump: We want to negotiate with Iran, but we have no negotiating partner.

