BitcoinWorld Loopring (LRC) Price Prediction 2026-2030: Critical Analysis of Recovery Potential and Market Trajectory As the cryptocurrency market continues itsBitcoinWorld Loopring (LRC) Price Prediction 2026-2030: Critical Analysis of Recovery Potential and Market Trajectory As the cryptocurrency market continues its

Loopring (LRC) Price Prediction 2026-2030: Critical Analysis of Recovery Potential and Market Trajectory

2026/03/25 07:35
Okuma süresi: 5 dk
Bu içerikle ilgili geri bildirim veya endişeleriniz için lütfen [email protected] üzerinden bizimle iletişime geçin.

BitcoinWorld
BitcoinWorld
Loopring (LRC) Price Prediction 2026-2030: Critical Analysis of Recovery Potential and Market Trajectory

As the cryptocurrency market continues its evolution beyond 2025, investors and analysts are closely examining the trajectory of specific Layer-2 solutions like Loopring (LRC). This analysis provides a comprehensive, evidence-based examination of Loopring’s potential price movements from 2026 through 2030, considering technological developments, market adoption, and broader economic factors. The central question remains whether LRC is positioned for a sustainable recovery or faces significant structural challenges in the coming years.

Loopring (LRC) Price Prediction 2026: Foundation and Immediate Outlook

Projecting Loopring’s price for 2026 requires analyzing its current technological foundation. Loopring operates as a zk-Rollup protocol designed to enhance Ethereum’s scalability. Consequently, its value proposition remains tightly coupled with Ethereum’s adoption and the competitive landscape of Layer-2 solutions. Market data from 2023-2025 shows that LRC’s price often correlates with network activity metrics like transaction volume and unique wallet growth.

Several factors will influence the 2026 outlook. First, the successful implementation of planned protocol upgrades is crucial. Second, the broader regulatory environment for decentralized exchanges (DEXs) will play a defining role. Finally, user migration from centralized platforms to secure, non-custodial solutions could provide a significant tailwind. Historical volatility patterns suggest that while short-term fluctuations are likely, the fundamental utility of the protocol will be the primary price driver.

Technical Roadmap and Ecosystem Growth for 2027-2028

The mid-term forecast for 2027 and 2028 hinges on Loopring’s execution of its technical roadmap. The development team has consistently emphasized improvements in transaction finality speed and cost reduction. Furthermore, strategic partnerships with wallet providers and other DeFi applications could substantially increase the network’s total value locked (TVL).

Expert Perspectives on Adoption Metrics

Industry analysts frequently highlight that sustainable growth for Layer-2 tokens depends on organic usage, not speculative trading. For instance, a report from a major blockchain analytics firm in late 2024 noted that protocols demonstrating consistent quarter-over-quarter growth in developer activity and dApp integration tend to outperform in subsequent years. Loopring’s commitment to open-source development and its grant program for ecosystem projects are positive signals tracked by these metrics.

Comparative analysis with other zk-Rollup solutions is also essential. The competitive intensity in the scaling sector means that technological differentiation and user experience are paramount. Loopring’s focus on specific use cases, such as high-frequency trading and NFT marketplaces, may carve out a defensible niche. Market share within the zk-Rollup segment will be a critical indicator to monitor through 2027.

Key Loopring Network Metrics (Hypothetical Projection)
Metric 2025 Baseline 2027 Projection Primary Driver
Daily Transactions ~85,000 ~250,000 dApp Integration
Average Fee (USD) ~$0.25 <$0.10 Protocol Optimization
Unique Active Wallets ~120,000 ~500,000 Wallet Partnerships

Long-Term Vision and 2029-2030 Price Trajectory Analysis

The long-term price prediction for Loopring extending to 2029 and 2030 enters the realm of strategic forecasting. This period will likely be defined by the maturation of the entire blockchain industry. Key considerations include the potential for Ethereum’s base layer improvements to reduce the relative advantage of Layer-2s and the possibility of widespread institutional adoption of scalable DEX infrastructure.

Potential positive scenarios for LRC involve:

  • Mass adoption of decentralized trading for both crypto and tokenized real-world assets.
  • Sustained technological leadership in zk-proof efficiency, maintaining a cost advantage.
  • Regulatory clarity that favors non-custodial, transparent financial protocols.

Conversely, challenges could stem from:

  • Intense competition from other Layer-2 and Layer-1 solutions with larger ecosystems.
  • Technational stagnation if development fails to keep pace with industry innovations.
  • Macro-economic headwinds that reduce risk appetite across all cryptocurrency investments.

Financial models often use discounted cash flow analyses based on projected fee revenue or comparisons to traditional financial exchange valuations. However, these models carry high uncertainty for nascent technologies. A more robust approach examines the protocol’s ability to capture value from the economic activity it secures and enables.

Conclusion

In summary, formulating a precise Loopring (LRC) price prediction for 2026 through 2030 is an exercise in analyzing probabilities, not delivering certainties. The token’s future value will be fundamentally tied to the network’s utility, security, and adoption. While the protocol possesses a strong technological foundation focused on efficient scaling, its success depends on execution amidst fierce competition and an evolving regulatory landscape. Investors should prioritize monitoring on-chain metrics, development progress, and partnership announcements over short-term price speculation. The path to recovery or growth for LRC will be paved by sustained, real-world usage of the Loopring network.

FAQs

Q1: What is the main factor that will influence Loopring’s price in 2026?
The primary factor will be the growth in organic network usage, measured by transaction volume, unique users, and Total Value Locked (TVL) in its zk-Rollup. Price often follows utility in mature crypto projects.

Q2: How does Loopring’s technology compare to other Layer-2 solutions?
Loopring utilizes zk-Rollup technology, offering strong security guarantees by bundling transactions and submitting validity proofs to Ethereum. Its focus has been on decentralized exchange (DEX) applications, competing with other zk-Rollups and Optimistic Rollups that may have different trade-offs in speed, cost, and generalizability.

Q3: Could Ethereum’s own upgrades make Loopring obsolete?
While Ethereum’s roadmap includes scalability improvements (like danksharding), experts anticipate a multi-layered future. Layer-2 solutions like Loopring are expected to remain crucial for achieving the high throughput and low costs needed for mass adoption, even as the base layer improves.

Q4: What are the biggest risks to the LRC price prediction for 2030?
The largest risks include technological disruption by a superior scaling solution, a failure to attract developer mindshare and build a vibrant dApp ecosystem, and adverse global regulations targeting decentralized finance protocols.

Q5: Is LRC considered a good long-term investment?
As a journalistic analysis, this article does not provide investment advice. The long-term viability of any cryptocurrency, including LRC, depends on its ability to solve real-world problems, achieve widespread adoption, and maintain a competitive technological edge. Investors should conduct thorough, independent research aligned with their risk tolerance.

This post Loopring (LRC) Price Prediction 2026-2030: Critical Analysis of Recovery Potential and Market Trajectory first appeared on BitcoinWorld.

Piyasa Fırsatı
Loopring Logosu
Loopring Fiyatı(LRC)
$0.01281
$0.01281$0.01281
+1.10%
USD
Loopring (LRC) Canlı Fiyat Grafiği
Sorumluluk Reddi: Bu sitede yeniden yayınlanan makaleler, halka açık platformlardan alınmıştır ve yalnızca bilgilendirme amaçlıdır. MEXC'nin görüşlerini yansıtmayabilir. Tüm hakları telif sahiplerine aittir. Herhangi bir içeriğin üçüncü taraf haklarını ihlal ettiğini düşünüyorsanız, kaldırılması için lütfen [email protected] ile iletişime geçin. MEXC, içeriğin doğruluğu, eksiksizliği veya güncelliği konusunda hiçbir garanti vermez ve sağlanan bilgilere dayalı olarak alınan herhangi bir eylemden sorumlu değildir. İçerik, finansal, yasal veya diğer profesyonel tavsiye niteliğinde değildir ve MEXC tarafından bir tavsiye veya onay olarak değerlendirilmemelidir.

Ayrıca Şunları da Beğenebilirsiniz
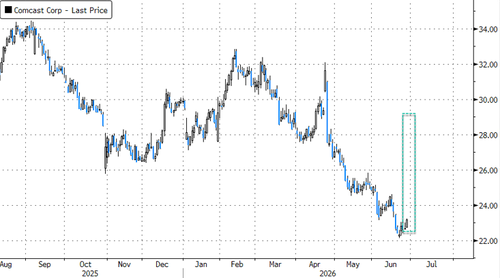
Ethereum koers toont zeldzaam dubbel koopsignaal en richt zich op $4.550

Ethereum koers toont zeldzaam dubbel koopsignaal en richt zich op $4.550

Connect met Like-minded Crypto Enthusiasts! Connect op Discord! Check onze Discord   Ethereum laat op de uurgrafiek twee opeenvolgende TD Sequential koopsignalen zien. Deze indicator meet uitputting in een trend en geeft vaak een signaal dat de verkoopdruk kan afnemen. Dit dubbele signaal verschijnt rond het niveau van $4.516, waar de ETH prijs kortstondig steun vindt. Dit type formatie komt zelden voor en wordt daarom extra nauwlettend gevolgd. Wat gaat de Ethereum koers hiermee doen? Ethereum koers test steun rond $4.516 De scherpe daling van de Ethereum koers vanaf de prijszone rond $4.800 bracht de ETH prijs in korte tijd naar ongeveer $4.516. Op dit niveau trad duidelijke koopactiviteit op, waardoor de neerwaartse beweging tijdelijk werd gestopt. Het dubbele signaal dat door de TD Sequential indicator is gegenereerd, viel precies samen met dit prijspunt. De TD Sequential is opgebouwd uit negen candles die een trend meetellen. Wanneer de negende candle verschijnt, kan dit duiden op een trendomslag. In dit geval verschenen zelfs twee signalen kort na elkaar, wat aangeeft dat de verkoopdruk mogelijk uitgeput is. Het feit dat dit gebeurde in een zone waar ETH kopers actief bleven, maakt het patroon extra opvallend. TD Sequential just flashed two buy signals for Ethereum $ETH! pic.twitter.com/JPO8EhiEPi — Ali (@ali_charts) September 16, 2025 Welke crypto nu kopen?Lees onze uitgebreide gids en leer welke crypto nu kopen verstandig kan zijn! Welke crypto nu kopen? Fed-voorzitter Jerome Powell heeft aangekondigd dat de rentes binnenkort zomaar eens omlaag zouden kunnen gaan, en tegelijkertijd blijft BlackRock volop crypto kopen, en dus lijkt de markt klaar om te gaan stijgen. Eén vraag komt telkens terug: welke crypto moet je nu kopen? In dit artikel bespreken we de munten die… Continue reading Ethereum koers toont zeldzaam dubbel koopsignaal en richt zich op $4.550 document.addEventListener('DOMContentLoaded', function() { var screenWidth = window.innerWidth; var excerpts = document.querySelectorAll('.lees-ook-description'); excerpts.forEach(function(description) { var excerpt = description.getAttribute('data-description'); var wordLimit = screenWidth wordLimit) { var trimmedDescription = excerpt.split(' ').slice(0, wordLimit).join(' ') + '...'; description.textContent = trimmedDescription; } }); }); Technische indicatoren schetsen herstelkans voor ETH Naast de dubbele koopsignalen verstrekken ook andere indicatoren belangrijke aanwijzingen. Tijdens de daling van de ETH koers waren grote rode candles zichtbaar, maar na de test van $4.516 stabiliseerde de Ethereum koers. Dit wijst op een mogelijke verschuiving in het evenwicht tussen de bears en bulls. Als deze opwaartse beweging doorzet, liggen de eerste weerstanden rond $4.550. Daarboven wacht een sterkere zone rond $4.650. Deze niveaus zijn in eerdere Ethereum sessies al meerdere keren getest. Een doorbraak zou ruimte openen richting de all-time high van ETH rond $4.953. Wanneer de prijs toch opnieuw onder $4.516 zakt, liggen er zones rond $4.500 en $4.450 waar grotere kooporders worden verwacht. Deze niveaus kunnen als een vangnet fungeren, mocht de druk opnieuw toenemen. Marktdynamiek bevestigt technische indicatoren De huidige situatie volgt op een bredere correctie in de cryptomarkt. Verschillende vooraanstaande crypto tokens zagen scherpe koersdalingen, waarna traders op zoek gingen naar signalen voor een mogelijke ommekeer. Dat juist Ethereum nu een dubbel TD Sequential signaal toont, versterkt de interesse in dit scenario. Fundamenteel blijft Ethereum sterk. Het aantal ETH tokens dat via staking is vastgezet, blijft groeien. Dat verkleint de vrije circulatie en vermindert verkoopdruk. Tegelijk blijft het netwerk intensief gebruikt voor DeFi, NFT’s en stablecoins. Deze activiteiten zorgen voor een stabiele vraag naar ETH, ook wanneer de prijs tijdelijk onder druk staat. Fundamentele drijfveren achter de Ethereum koers De Ethereum koers wordt echter niet alleen bepaald door candles en patronen, maar ook door bredere factoren. Een stijgend percentage van de totale ETH supply staat vast in staking contracten. Hierdoor neemt de liquiditeit op exchanges af. Dit kan prijsschommelingen versterken wanneer er plotseling meer koopdruk ontstaat. Daarnaast is Ethereum nog steeds het grootste smart contract platform. Nieuwe standaarden zoals ERC-8004 en ontwikkelingen rond layer-2 oplossingen houden de activiteit hoog. Deze technologische vooruitgang kan de waardepropositie ondersteunen en zo indirect bijdragen aan een ETH prijsherstel. Het belang van de korte termijn dynamiek De komende handelsdagen zullen duidelijk maken of de bulls genoeg kracht hebben om door de weerstandszone rond $4.550 te breken. Voor de bears ligt de focus juist op het verdedigen van de prijsregio rond $4.516. De whales, die met grote handelsorders opereren, kunnen hierin een beslissende rol spelen. Het dubbele TD Sequential signaal blijft hoe dan ook een zeldzame gebeurtenis. Voor cryptoanalisten vormt het een objectief aanknopingspunt om de kracht van de huidige Ethereum trend te toetsen. Vooruitblik op de ETH koers Ethereum liet twee opeenvolgende TD Sequential signalen zien op de uurgrafiek, iets wat zelden voorkomt. Deze formatie viel samen met steun rond $4.516, waar de bulls actief werden. Als de Ethereum koers boven dit niveau blijft, kan er ruimte ontstaan richting $4.550 en mogelijk $4.650. Zakt de prijs toch opnieuw onder $4.516, dan komen $4.500 en $4.450 in beeld als nieuwe steunzones. De combinatie van zeldzame indicatoren en een sterke fundamentele basis maakt Ethereum interessant voor zowel technische als fundamentele analyses. Of de bulls het momentum echt kunnen overnemen, zal blijken zodra de Ethereum koers de eerstvolgende weerstanden opnieuw test. Koop je crypto via Best Wallet Best wallet is een topklasse crypto wallet waarmee je anoniem crypto kan kopen. Met meer dan 60 chains gesupport kan je al je main crypto coins aanschaffen via Best Wallet. Best wallet - betrouwbare en anonieme wallet Best wallet - betrouwbare en anonieme wallet Meer dan 60 chains beschikbaar voor alle crypto Vroege toegang tot nieuwe projecten Hoge staking belongingen Lage transactiekosten Best wallet review Koop nu via Best Wallet Let op: cryptocurrency is een zeer volatiele en ongereguleerde investering. Doe je eigen onderzoek. Het bericht Ethereum koers toont zeldzaam dubbel koopsignaal en richt zich op $4.550 is geschreven door Dirk van Haaster en verscheen als eerst op Bitcoinmagazine.nl.
Paylaş
Coinstats2025/09/17 23:31
Fed Day Dry Powder: Cryptoquant Analyst Tracks $7.6B Stablecoin Pile on Exchanges

Fed Day Dry Powder: Cryptoquant Analyst Tracks $7.6B Stablecoin Pile on Exchanges

The post Fed Day Dry Powder: Cryptoquant Analyst Tracks $7.6B Stablecoin Pile on Exchanges appeared on BitcoinEthereumNews.com. With the Federal Reserve meeting today, onchain flows are telegraphing that crypto traders are topping off exchanges and leaning long ahead of a widely expected 25-basis-point cut. Pre-Fed Positioning Stablecoins are doing the heavy lifting. Cryptoquant data shows $7.6 billion in fresh USDT and USDC (ERC-20) deposits heading to trading venues ahead of the decision. […] Source: https://news.bitcoin.com/fed-day-dry-powder-cryptoquant-analyst-tracks-7-6b-stablecoin-pile-on-exchanges/
Paylaş
BitcoinEthereumNews2025/09/18 01:36
Michael Saylor’s Bitcoin Treasury Strategy Has Finally Hit Its Breaking Point

Michael Saylor’s Bitcoin Treasury Strategy Has Finally Hit Its Breaking Point

Bitcoin (CRYPTO:BTC) transformed from a niche digital asset into a mainstream investment over the past decade, and few people did more to accelerate that shift
Paylaş
247 Wall St.2026/06/28 20:17

Newbies:Deposit $100, Get $1,000

Newbies:Deposit $100, Get $1,000Newbies:Deposit $100, Get $1,000

Plus Up to a $50 Referral Bonus