After a dramatic drop below the value area low, Pi Network has shown strong signs of recovery, bouncing from its swing low with aggressive demand. The buying wick printed on the latest daily candle confirms a strong reaction from what…After a dramatic drop below the value area low, Pi Network has shown strong signs of recovery, bouncing from its swing low with aggressive demand. The buying wick printed on the latest daily candle confirms a strong reaction from what…

Pi crypto value rebounds: key levels to watch

After a dramatic drop below the value area low, Pi Network has shown strong signs of recovery, bouncing from its swing low with aggressive demand. The buying wick printed on the latest daily candle confirms a strong reaction from what appears to be a maximum value zone.

Pi Network’s (PI) price action took a steep hit as it fell below the value area low and traded directly into a macro swing low support. However, this flush was met with immediate demand, leading to a sharp intraday recovery and a strong close back above high-timeframe support. The technical bounce was characterized by a prominent buying tail, a classic signature of value-based demand, now placing Pi in a potential reversal zone

Key technical points

  • Break Below Value Area Low: Price dipped under the VAL and found strong buy-side pressure at the swing low region.
  • Impressive Recovery Candle: The wick and close above support confirm aggressive market interest and demand.
  • Reclaiming the Value Area Low: Sustained closes above this level confirm validation of the demand zone.
  • Key Resistance at $0.65: Breaking this dynamic resistance would confirm a trend shift and open room for a move toward $0.80.
Pi crypto value rebounds: key levels to watch - 1

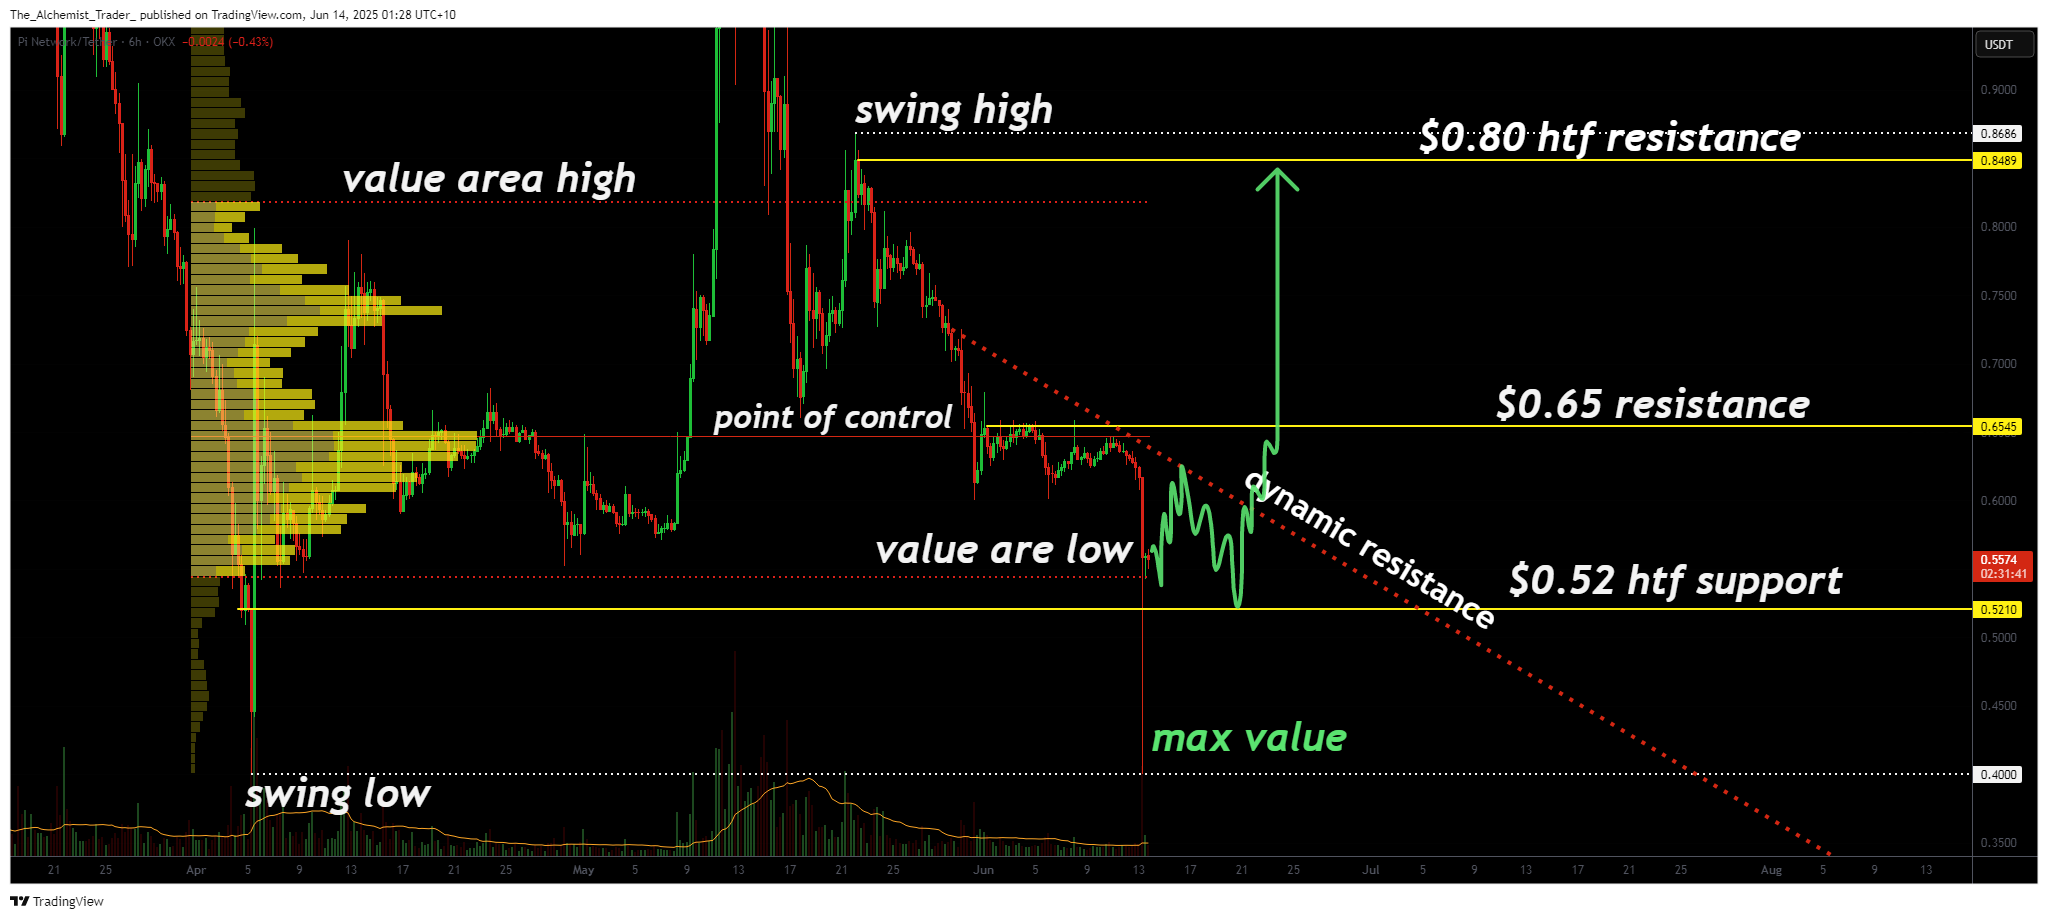
The drop below the value area low initially looked like a breakdown, but Pi Network’s price quickly reversed after reaching a key swing low, a high-interest liquidity pocket. The strong buying tail formed on the candle reflects not only rejection of lower prices but also signals the presence of maximum value buyers stepping into the market.

Price has now closed back above the high-timeframe support and is showing signs of acceptance above the value area low. This reclaim is critical. From a market profile perspective, acceptance back above the value area low after a failed breakdown often signals a trap and provides high-probability long setups.

The next obstacle for bulls is clear: dynamic resistance near $0.65. A clean break above this level would shift short-term market structure into a higher high formation, signaling early-stage reversal potential after the sharp sell-off. If Pi Network can breach this resistance and sustain momentum, the next magnet will likely be the $0.80 level, aligning with the upper boundary of the trading range and value area high.

What to expect in the coming price action

As long as Pi Network holds above the value area low and builds support on higher time frames, price remains positioned for a move toward $0.65 and then $0.80. The sharp bounce from maximum value confirms that buyers are active, and a structural reversal could be underway if dynamic resistance breaks.

Piyasa Fırsatı
Areon Network Logosu
Areon Network Fiyatı(AREA)
$0.00496
$0.00496$0.00496
+3.76%
USD
Areon Network (AREA) Canlı Fiyat Grafiği
Sorumluluk Reddi: Bu sitede yeniden yayınlanan makaleler, halka açık platformlardan alınmıştır ve yalnızca bilgilendirme amaçlıdır. MEXC'nin görüşlerini yansıtmayabilir. Tüm hakları telif sahiplerine aittir. Herhangi bir içeriğin üçüncü taraf haklarını ihlal ettiğini düşünüyorsanız, kaldırılması için lütfen [email protected] ile iletişime geçin. MEXC, içeriğin doğruluğu, eksiksizliği veya güncelliği konusunda hiçbir garanti vermez ve sağlanan bilgilere dayalı olarak alınan herhangi bir eylemden sorumlu değildir. İçerik, finansal, yasal veya diğer profesyonel tavsiye niteliğinde değildir ve MEXC tarafından bir tavsiye veya onay olarak değerlendirilmemelidir.

Ayrıca Şunları da Beğenebilirsiniz

MAXI DOGE Holders Diversify into $GGs for Fast-Growth 2025 Crypto Presale Opportunities

MAXI DOGE Holders Diversify into $GGs for Fast-Growth 2025 Crypto Presale Opportunities

Presale crypto tokens have become some of the most active areas in Web3, offering early access to projects that blend culture, finance, and technology. Investors are constantly searching for the best crypto presale to buy right now, comparing new token presales across different niches. MAXI DOGE has gained attention for its meme-driven energy, but early [...] The post MAXI DOGE Holders Diversify into $GGs for Fast-Growth 2025 Crypto Presale Opportunities appeared first on Blockonomi.
Paylaş
Blockonomi2025/09/18 00:00
Edges higher ahead of BoC-Fed policy outcome

Edges higher ahead of BoC-Fed policy outcome

The post Edges higher ahead of BoC-Fed policy outcome appeared on BitcoinEthereumNews.com. USD/CAD gains marginally to near 1.3760 ahead of monetary policy announcements by the Fed and the BoC. Both the Fed and the BoC are expected to lower interest rates. USD/CAD forms a Head and Shoulder chart pattern. The USD/CAD pair ticks up to near 1.3760 during the late European session on Wednesday. The Loonie pair gains marginally ahead of monetary policy outcomes by the Bank of Canada (BoC) and the Federal Reserve (Fed) during New York trading hours. Both the BoC and the Fed are expected to cut interest rates amid mounting labor market conditions in their respective economies. Inflationary pressures in the Canadian economy have cooled down, emerging as another reason behind the BoC’s dovish expectations. However, the Fed is expected to start the monetary-easing campaign despite the United States (US) inflation remaining higher. Investors will closely monitor press conferences from both Fed Chair Jerome Powell and BoC Governor Tiff Macklem to get cues about whether there will be more interest rate cuts in the remainder of the year. According to analysts from Barclays, the Fed’s latest median projections for interest rates are likely to call for three interest rate cuts by 2025. Ahead of the Fed’s monetary policy, the US Dollar Index (DXY), which tracks the Greenback’s value against six major currencies, holds onto Tuesday’s losses near 96.60. USD/CAD forms a Head and Shoulder chart pattern, which indicates a bearish reversal. The neckline of the above-mentioned chart pattern is plotted near 1.3715. The near-term trend of the pair remains bearish as it stays below the 20-day Exponential Moving Average (EMA), which trades around 1.3800. The 14-day Relative Strength Index (RSI) slides to near 40.00. A fresh bearish momentum would emerge if the RSI falls below that level. Going forward, the asset could slide towards the round level of…
Paylaş
BitcoinEthereumNews2025/09/18 01:23
The Contrarian Truth: Why Bitcoin and Ethereum Prices Defy Social Media Sentiment

The Contrarian Truth: Why Bitcoin and Ethereum Prices Defy Social Media Sentiment

BitcoinWorld The Contrarian Truth: Why Bitcoin and Ethereum Prices Defy Social Media Sentiment Have you ever noticed that when everyone on social media is screaming
Paylaş
bitcoinworld2025/12/20 07:45