Solana Whale Returns After Seven Months With Major SOL And JUP Buys
Solana whale Emb5os returns after seven months, adding $17.12M in SOL and 10.32M JUP as SOL trades near $95.01.
A Solana whale labeled “Emb5os” has returned after seven months of inactivity with large SOL and JUP purchases.
The wallet accumulated $17.12 million in SOL and 10.32 million JUP, worth about $2.56 million, over three days.
The activity comes as Solana trades near $95.01 and remains below key resistance levels.
Whale Emb5os Adds SOL and JUP After Long Pause
The wallet known as “Emb5os” resumed activity after seven months without major reported moves. The whale accumulated large positions in Solana and Jupiter over the last three days.
The total SOL purchase was worth about $17.12 million. The wallet also added 10.32 million JUP, valued at about $2.56 million.
The latest transaction included 73,253 SOL, worth about $7.12 million. The same move also added 2.5 million JUP, valued near $620,500.
The assets were added through Fireblocks, according to the reported wallet activity. Fireblocks is widely used for digital asset custody and transfers.
Large whale purchases are often watched by market participants. They can show renewed interest from large holders, but they do not confirm future price direction.
Solana Trades Below Key Fibonacci Levels
Solana was trading near $95.01 on the daily chart. The asset was down 2.41% at the time of the chart reading.
SOL remains below the main Fibonacci range shown on the chart. The key retracement area runs from $112.38 to $234.68.
The $112.38 level is the nearest major resistance. A move above that level would be needed to reduce current downside pressure.
The chart shows that SOL faced a strong rejection near $240 to $260 in late 2025. Since then, the price has formed lower highs.
Solana also dropped below the $138.56 and $112.38 levels. That move confirmed a weaker medium-term market structure.
The nearest support zone sits around $90 to $95. A daily close below that zone could bring focus to $80 to $85.
If sellers keep control, the next lower support may sit near $70. That area matches an earlier accumulation zone on the chart.
Read Also:
RSI and MACD Show Short-Term Strength
The RSI is near 65.95, while its signal line is around 57.00. This shows that short-term buying momentum has improved.
The RSI is also moving closer to the 70 level. That area is often watched for overheated short-term conditions.
If RSI moves above 70, buyers may attempt another push. But a turn lower could show that the latest move is slowing.
The MACD also shows a bullish crossover on the daily chart. The MACD line is near 2.61, and the signal line is near 1.36.
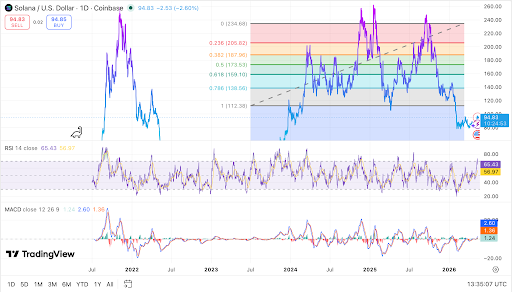 SOL trades near $94.83 as momentum indicators improve, source: TradingView.
The histogram is positive at about 1.25. This supports improving short-term momentum while SOL remains below major resistance.
Solana’s wider setup remains cautious below $112.38. A breakout above that level could open a move toward $138.56.
A failure to hold $90 to $95 could expose $80 to $85. The whale’s return adds fresh market attention, but price confirmation remains important.
The post Solana Whale Returns After Seven Months With Major SOL And JUP Buys appeared first on Live Bitcoin News.


Ayrıca Şunları da Beğenebilirsiniz

Euro Slips Below 1.1750 as Stronger US Inflation Data Lifts Dollar

Trump Says Trade, Not Iran, to Dominate Agenda at Upcoming Summit With Xi