

XRP’s October Performance: Why ‘Uptober’ Is More Myth Than Reality
- XRP’s October history reveals extreme volatility, with rare positive spikes.
- XRP’s October returns show inconsistent performance, with significant yearly fluctuations.
- October for XRP: dramatic gains overshadowed by frequent double-digit losses
A few explosive events often distort XRP’s October price history. While the crypto community celebrates “Uptober,” historical data does not support this optimistic trend for XRP. The coin’s fluctuations during this month have been volatile, with more downs than ups.
XRP has seen several significant rallies in October, but these tend to be exceptions rather than the rule. In fact, its median monthly return for October is negative. This contradicts the idea that October consistently delivers positive returns for XRP.
Also Read: SEC to Review Multiple XRP ETF Applications in October: What’s at Stake?
XRP’s October Record Shows Volatility
XRP’s performance has been very high, with immense gains and great losses over the years. In 2013, XRP surged by more than 94%. It surged by 130% the following year, and in 2017, it was only increasing by 1.49%, as per cryptorank. However, some years produced notable declines. In 2018 and 2021, XRP had losses in the double digits. The situation has been sporadic at best despite periodical rallies.
According to analysts, the XRP results in October show a mixed picture. October 2020 was the most dramatic, with an incredible rise in the price of XRP by nearly 179% in one month. However, these peaks are exceptions in the history of the price of a coin. The past has indicated that October has been more of a month of corrections rather than steady growth.
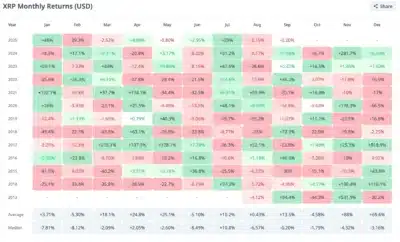
Source: CryptoRank
XRP’s Median October Return Points to Losses
The median XRP October return is quite negative. It is a loss of 1.79%, much different from the myth of “Uptober” that is so popular. Indeed, October shows worse returns, at -4.58% on average for XRP. These data reveal the inconsistency of XRP performance throughout the years in October.
October’s swings have been largely influenced by outlier events, making the data hard to generalize. The majority of the income that XRP has had this month is through isolated years, including 2020. But such extraordinary years do not give a sound trend to the coin. The results of XRP in October support the fact that the month has no profitability assurance.
Q4 Trends Offer Some Optimism for XRP, But Risks Persist
Although the performance showed some volatility in October, the fourth quarter (Q4) is generally more favourable to XRP. Q4, on average, gives XRP a healthy increase of almost 88% gain. However, despite the positive trends of Q4, the median return shows losses of 4.32%. The results during the fourth quarter, as in the case of October, are usually influenced by a few outstanding years that are so outstanding that they cover the expected results. The investors have to take the months ahead, Uptober, with a grain of salt, since history indicates that it is more folklore than fact.
Also Read: Can Dogecoin Hold $0.24 or Will It Plunge to $0.19? Experts Weigh In!
The post XRP’s October Performance: Why ‘Uptober’ Is More Myth Than Reality appeared first on 36Crypto.
Ayrıca Şunları da Beğenebilirsiniz

XRP price weakens at critical level, raising risk of deeper pullback
Copy linkX (Twitter)LinkedInFacebookEmail

Wormhole Unveils W Token 2.0 with Enhanced Tokenomics
