Solana (SOL) Price: Oversold Signals Emerge Following Crash to $68
TLDR
- Solana (SOL) dropped to $68 before recovering to $80 amid broader crypto market selloff and persistent bearish pressure.
- Weekly chart shows broken head-and-shoulders pattern with RSI entering oversold territory, signaling potential for relief rally.
- SOL testing key demand zone around $80 where historical buyer activity could trigger rebound or further decline.
- Technical indicators show downside momentum remains intact with all major moving averages positioned above current price.
- Trading volume of $16.53 billion and market cap of $46.20 billion as price action reflects broader altcoin weakness.
Solana continued to decline on Thursday, February 5, 2026, as the broader crypto market remained under pressure. The token dropped to $68 before recovering to trade at $80.
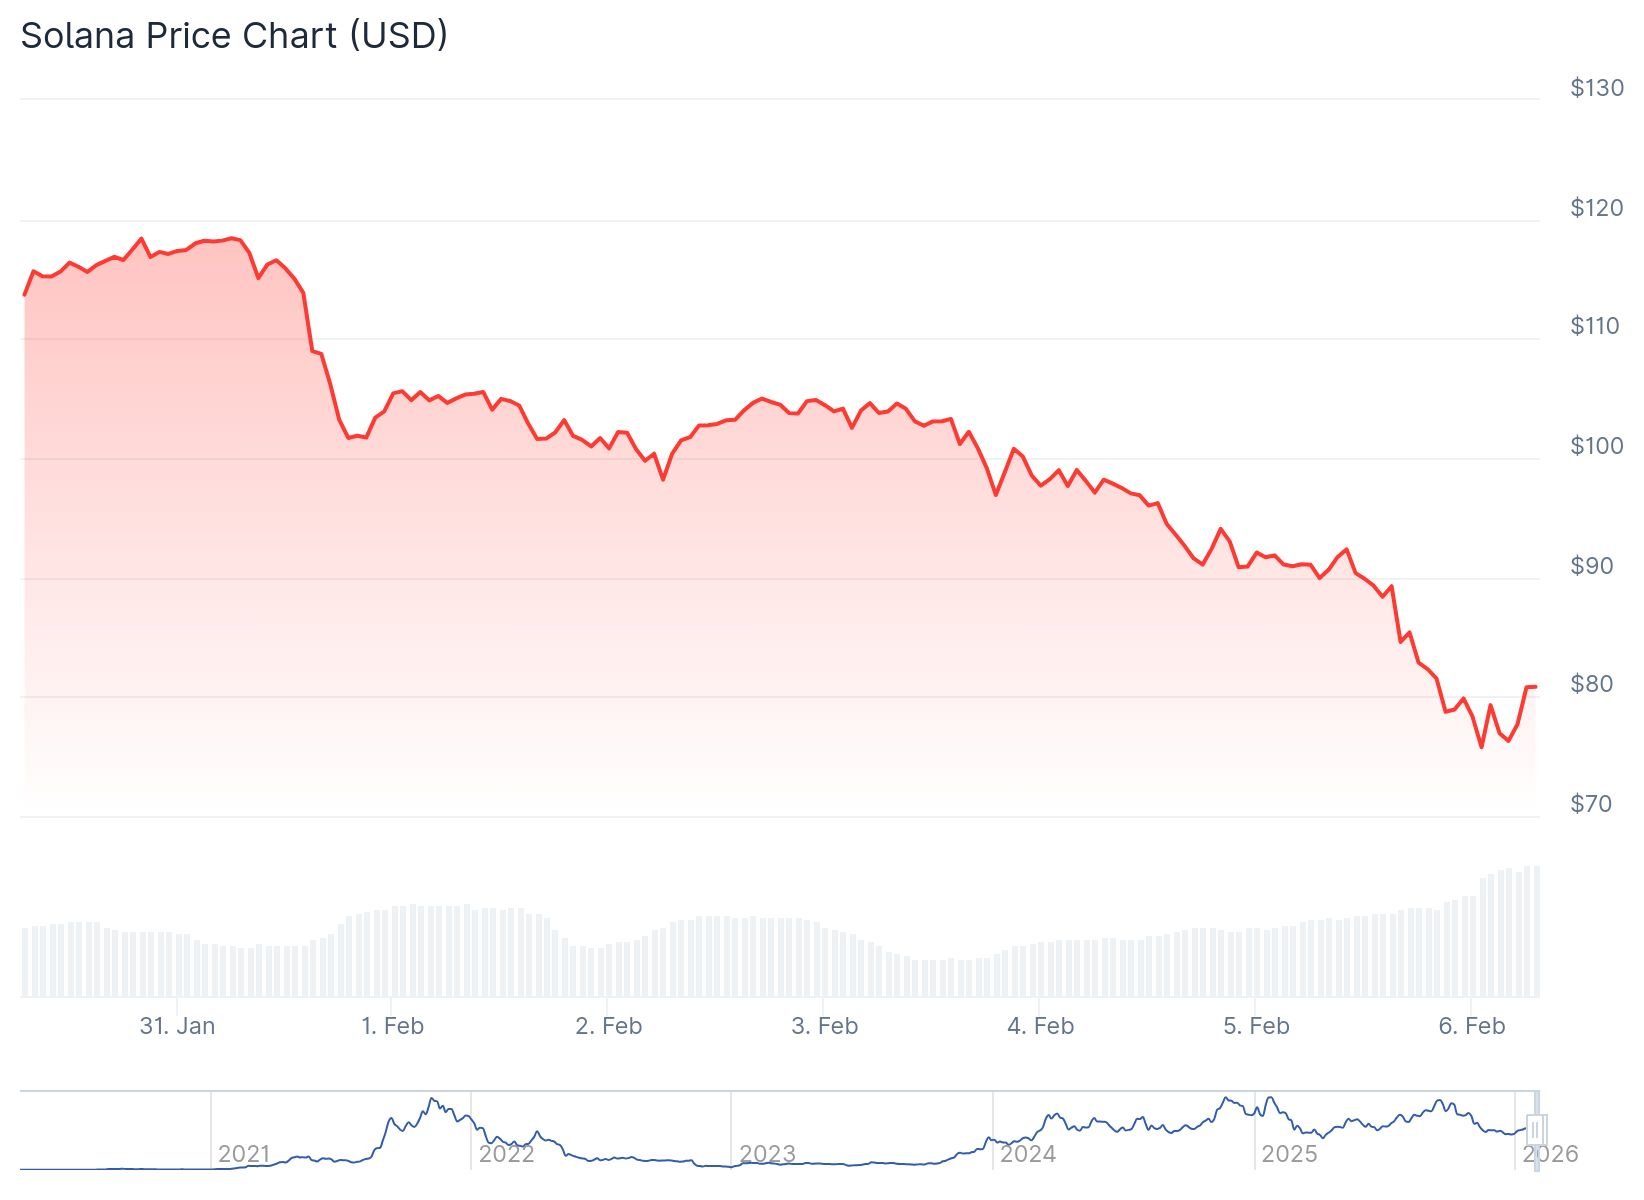 Solana (SOL) Price
The price movement represents a 12.20% decline over a 24-hour period. Trading volume reached $16.53 billion with a market capitalization of $46.20 billion.
Crypto analyst CryptoPulse identified a head and shoulders pattern on the weekly chart. The pattern broke below the neckline, indicating a possible trend reversal and weakening upward momentum.
The Relative Strength Index entered oversold territory. This technical condition sometimes signals a potential rebound in price.
Testing Historical Demand Zones
Market observer BitGuru noted that Solana is nearing a known demand zone. This area showed buyer activity in the past.
The current price level around $80 represents a critical test. A hold here could lead to a bounce, while a break lower could push the token toward the $72-$75 range.
All major moving averages sit above the current price. The 50-day moving average trends lower near $105, while the 100-day and 200-day averages remain higher.
The technical structure shows a sequence of lower highs and lower lows on the daily chart. This pattern confirms the bearish continuation signal.
The MACD indicator remains in negative territory with the signal line below zero. The histogram continues to print red bars, showing downside momentum is still active.
Volume and Market Dynamics
Selling volume expanded during the move below $85. This suggests genuine participation rather than thin liquidity conditions.
The RSI remains below the neutral 50 mark. This indicates downside pressure is dominant without reaching deeply oversold conditions yet.
Altcoins have underperformed as traders rotate toward cash or higher-liquidity assets. Solana has followed this trend despite strong ecosystem and developer activity.
Recent discussions around potential Solana-linked exchange-traded products have provided a long-term positive narrative. However, this optimism is not translating into near-term buying pressure.
The failure to hold above $100 earlier in the year already signaled weakening confidence. The subsequent drop below $85 reinforced fragile sentiment.
Analyst Anton Kharitonov says Solana remains under strong technical pressure. He cites bearish momentum, oversold signals and ongoing institutional outflows despite solid on-chain activity.
Kharitonov remains defensive on SOL until the price can reclaim and hold above $102. He notes heavy resistance and a lack of near-term catalysts.
Solana is trading at $80 after dropping to $68, with key support zones and oversold technical indicators in focus as the token tests historical demand areas.
The post Solana (SOL) Price: Oversold Signals Emerge Following Crash to $68 appeared first on CoinCentral.
Ayrıca Şunları da Beğenebilirsiniz

The Next Bitcoin Story Of 2025

Strategy Defines Its Bitcoin Stress Point After Q4 Volatility