A long-term Bitcoin indicator tracked by analyst bitcoindata21 is close to flashing again, pointing to the possibility of another price surge. The signal is triggered whenever the market touches a yellow upward trendline that has historically marked the beginning of major rallies. This observation comes at a time of subdued sentiment in the crypto market, with growing fears of a bear phase that could see Bitcoin dip below the $100K level. Bitcoin is currently holding at $113,300, down 0.15% over the past day, while its weekly chart shows a 4.71% loss. Meanwhile, bitcoindata21 is offering hope for another round of green trading days based on technical analysis. Historical Precedent The accompanying chart shows multiple past instances when Bitcoin tagged this trendline, each followed by decisive upward momentum. Specifically, from early 2017 to 2021, and again in 2023, every contact with the line preceded meaningful gains. The analyst emphasized that the signal “has never failed so far.” In the current setup, Bitcoin is trading around $113,000, while the chart suggests the next touch of the trendline is imminent. The analyst is confident that history will repeat and that the event will serve as the trigger for the next leg higher. 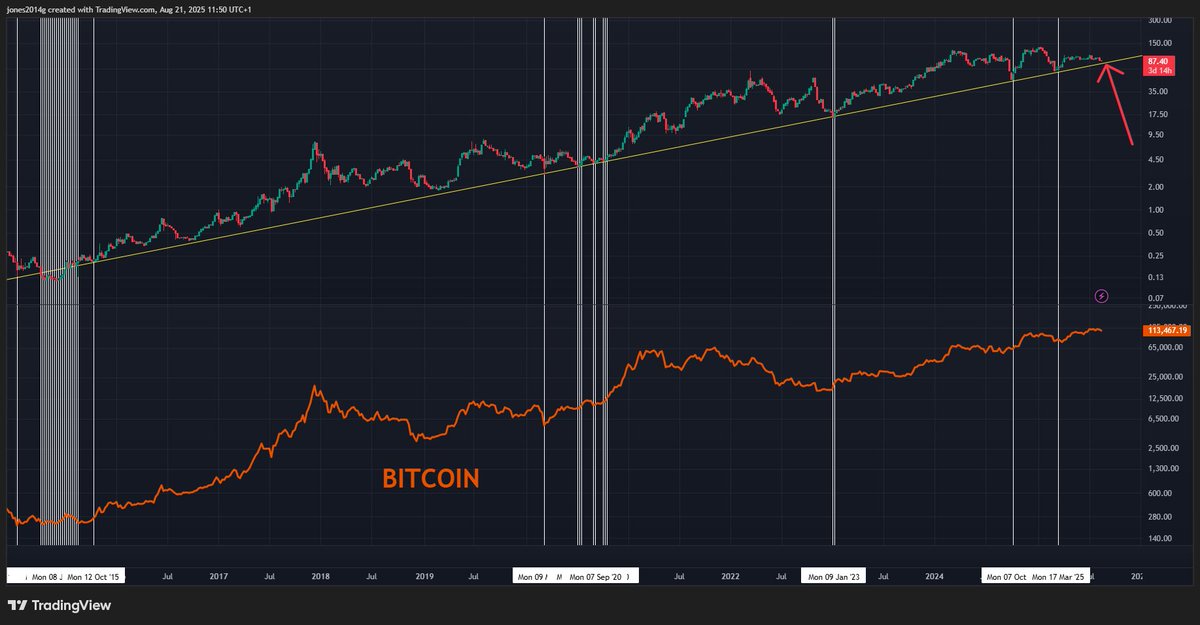 bitcoindata21's Bitcoin chart What to Expect from Bitcoin Commenting on bitcoindata21’s post, one X user remarked that the comeback could see Bitcoin hit $145,000. Notably, other market watchers are also using technical indicators to call for a rebound. At the same time, some believe there is still a risk of a significant dip. For instance, analyst CasiTrades has warned of a likely drop to $88K if Bitcoin bulls fail to maintain a price above the $122,000 level. CasiTrades, a technical analyst with over a decade of experience, believes Bitcoin completed Wave 1 of a corrective pattern at $112,500 and is now in a Wave 2 rebound. This bounce could push BTC toward the $119,900–$121,900 range, but failure to break higher may trigger a steep Wave 3 decline. However, if Bitcoin surpasses its $124,500 high, the bearish outlook would be invalidated. Meanwhile, Michael XBT, another veteran market watcher, believes calling for a major dump at this stage is premature. https://twitter.com/MichaelXBT/status/1958202430018953266 "Road to $1M BTC Remains Intact" Regardless of Bitcoin’s short-term patterns, there is almost a consensus regarding its long-term uptrend. Many expect Bitcoin to potentially experience a 10X price surge in the coming years. For instance, Coinbase CEO Brian Armstrong has joined other industry leaders in predicting that Bitcoin could reach $1 million within the next five years.
Sorumluluk Reddi: Bu sitede yeniden yayınlanan makaleler, halka açık platformlardan alınmıştır ve yalnızca bilgilendirme amaçlıdır. MEXC'nin görüşlerini yansıtmayabilir. Tüm hakları telif sahiplerine aittir. Herhangi bir içeriğin üçüncü taraf haklarını ihlal ettiğini düşünüyorsanız, kaldırılması için lütfen
[email protected] ile iletişime geçin. MEXC, içeriğin doğruluğu, eksiksizliği veya güncelliği konusunda hiçbir garanti vermez ve sağlanan bilgilere dayalı olarak alınan herhangi bir eylemden sorumlu değildir. İçerik, finansal, yasal veya diğer profesyonel tavsiye niteliğinde değildir ve MEXC tarafından bir tavsiye veya onay olarak değerlendirilmemelidir.