

Solana (SOL) Price: Buyers Step In at Critical Level While ETF Investors Add Exposure
TLDR
- Solana (SOL) is trading around $80 after recovering from a low of $75.64
- A swing failure pattern (SFP) has formed at the 0.618 Fibonacci support level, suggesting a potential short-term reversal
- Key resistance levels to watch are $82, $84, and $85, with $92 and $95 as further upside targets
- Reclaiming $78–$82 is critical to confirm any bullish structure
- Bitwise’s BSOL staking ETF pulled in over $3 million in fresh inflows on February 23, even as SOL’s price remains down ~41% over three months
Solana is attempting a recovery after dropping to a low of $75.64. The price climbed back above $80 and is now trading above the 100-hourly simple moving average.
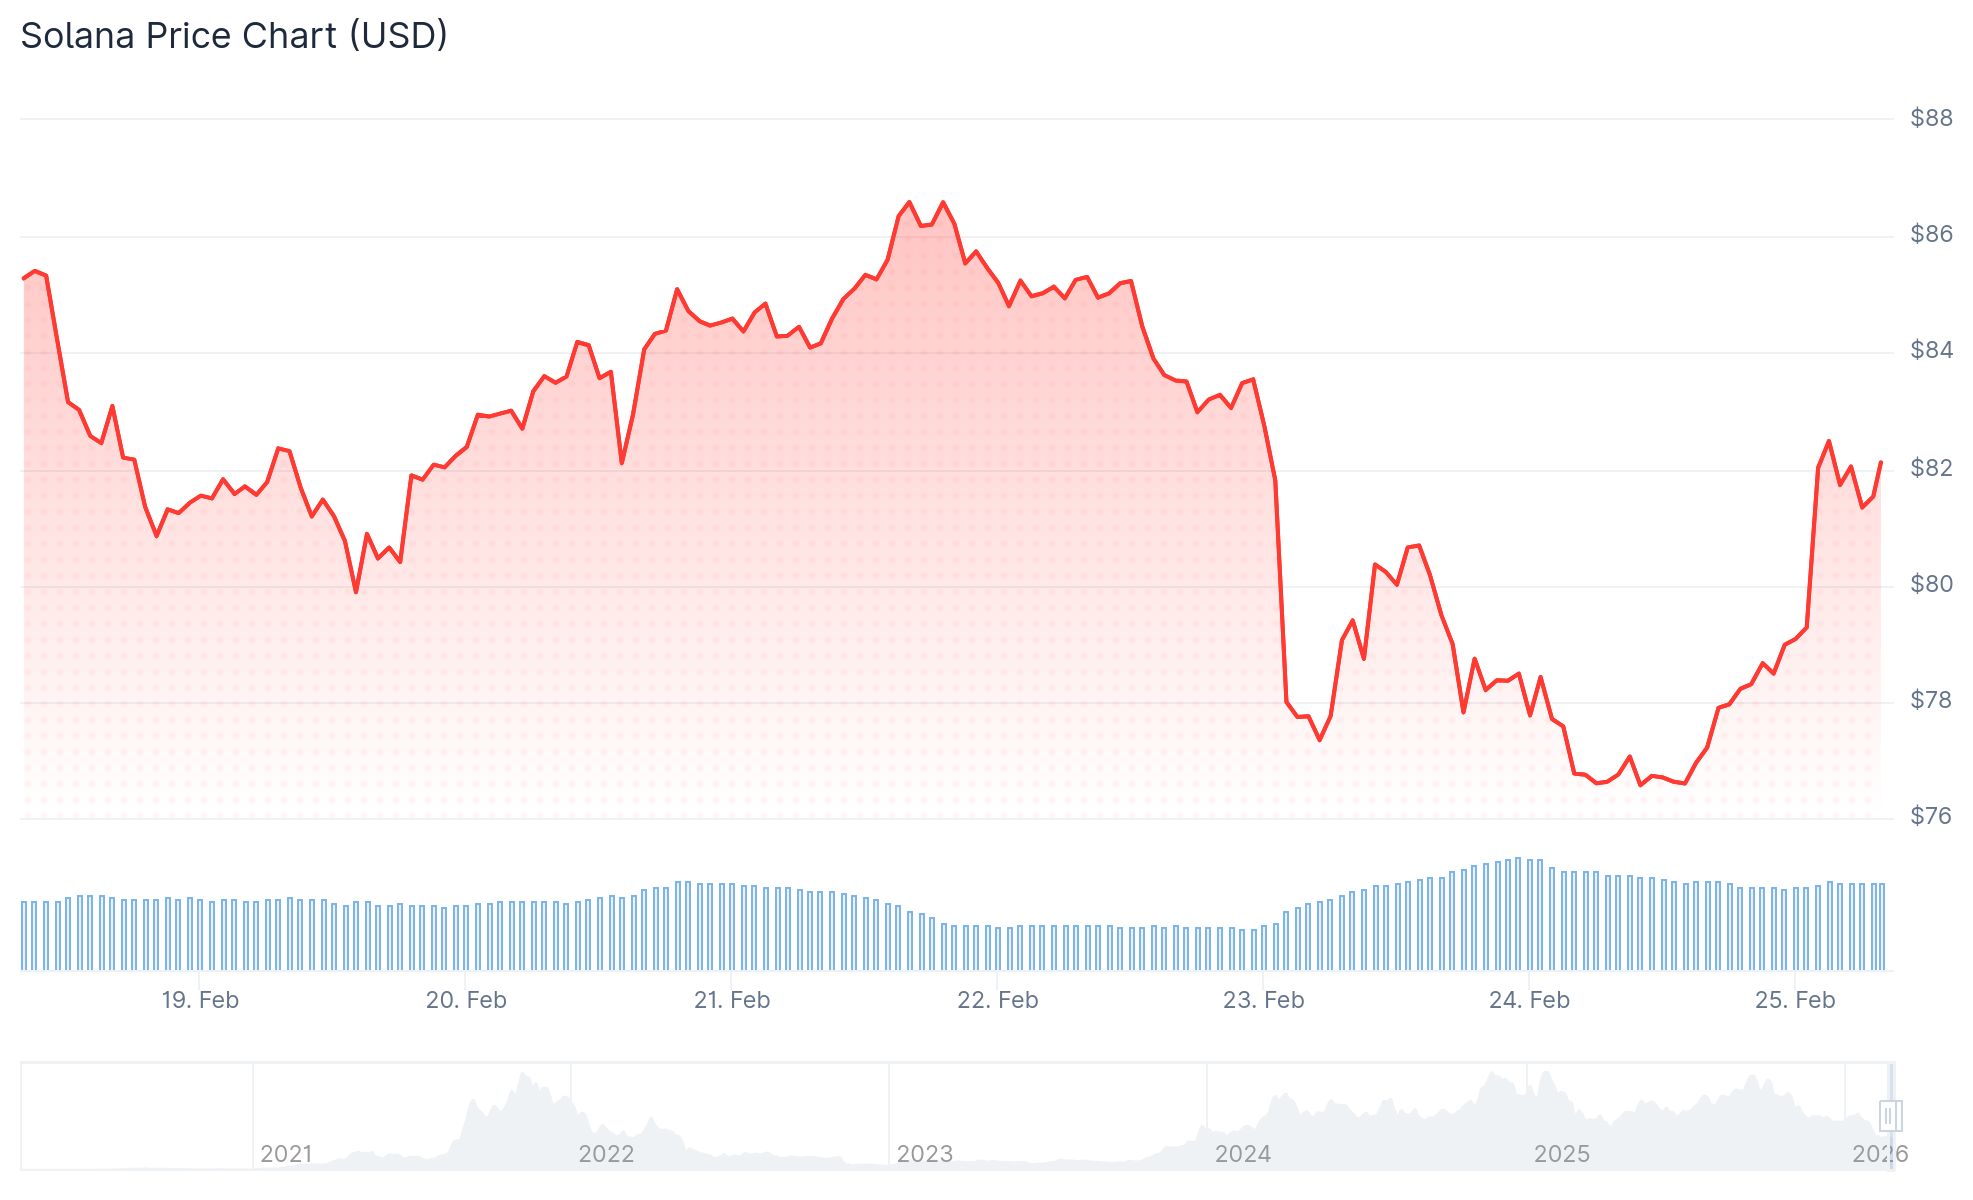 Solana (SOL) Price
The move came after SOL broke above a bearish trend line that had been holding resistance at $81 on the hourly chart.
SOL also pushed above the 50% Fibonacci retracement level of the drop from $86.68 to $75.64. That’s a mild positive sign for short-term price action.
Sellers are still active near $82.50, which lines up with the 61.8% Fibonacci retracement level. That zone is the next hurdle bulls need to clear.
A swing failure pattern (SFP) has formed at the 0.618 Fibonacci support. This happens when price briefly breaks below a prior low, sweeps stop-loss orders, and then quickly reverses higher.
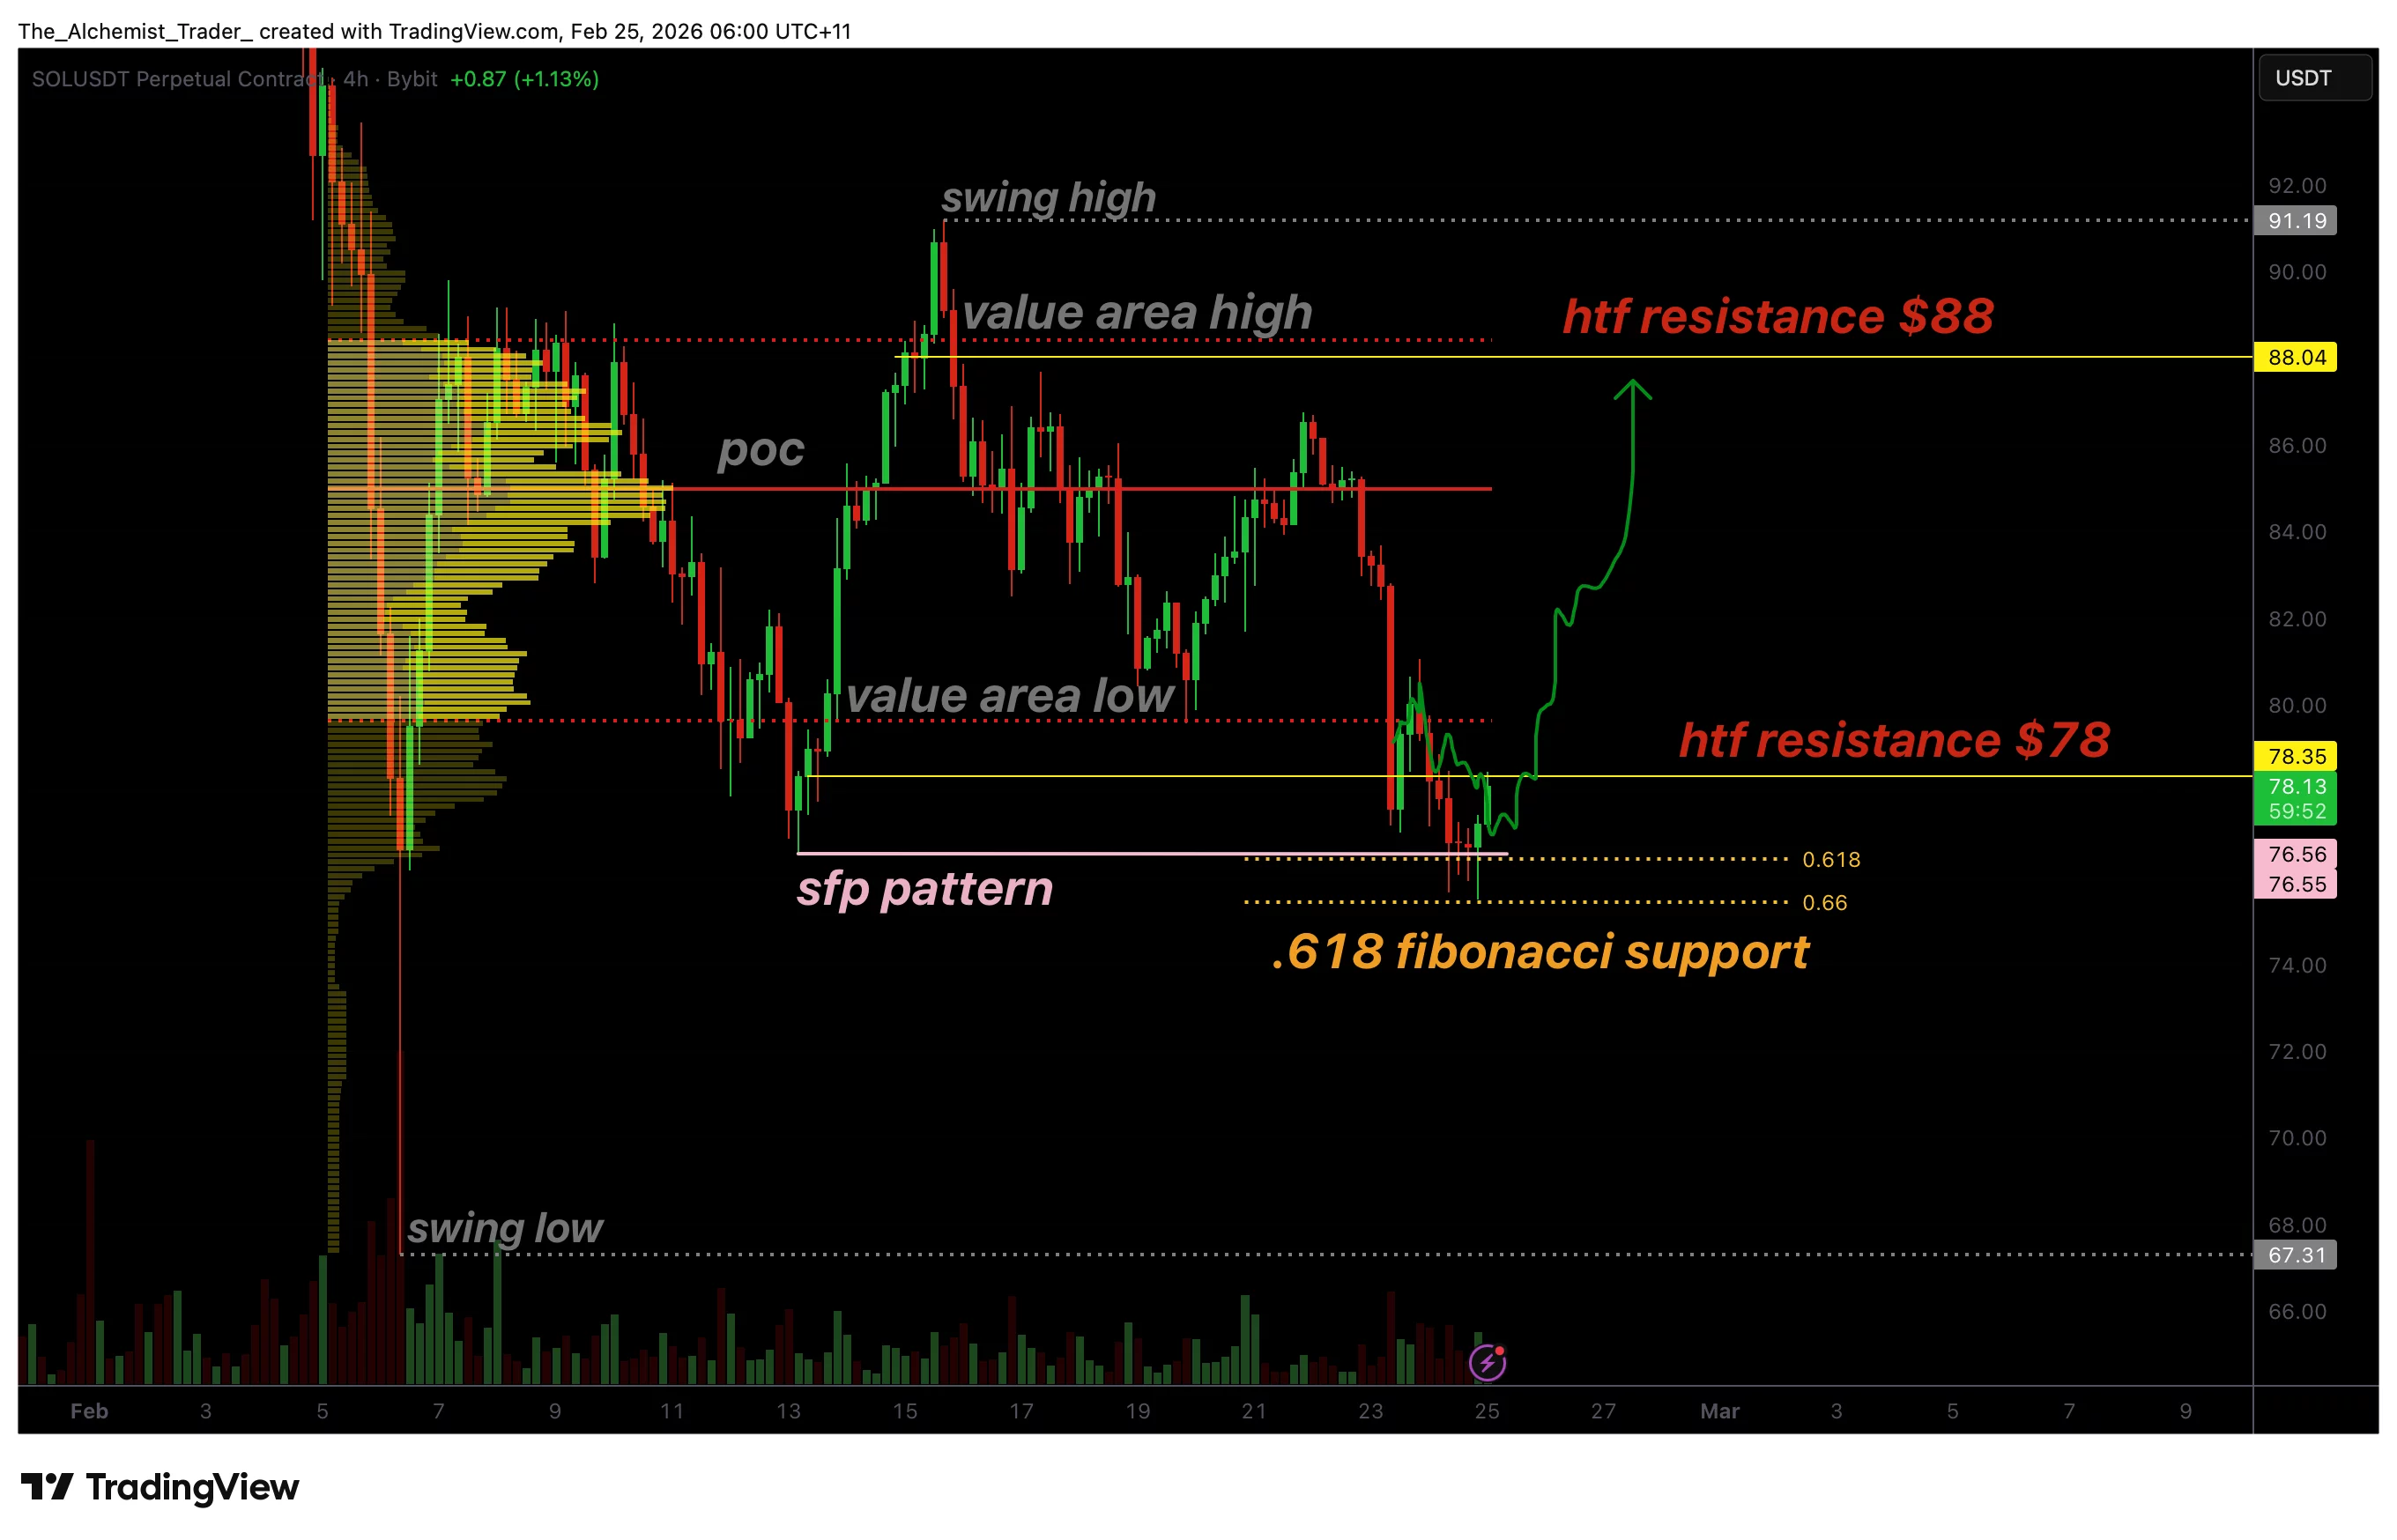 Source; TradingView
Multiple downside wicks on the chart show that sellers tried to push the price lower but couldn’t hold it there. Buyers stepped in and absorbed the selling pressure.
This pattern is seen as a possible sign that a local bottom is forming, though confirmation is still needed.
$78 Is the Key Level to Watch
For the recovery to gain credibility, SOL needs to reclaim and hold above $78. This level is considered local resistance and a key decision point for the short-term direction.
Holding above $78 would also put SOL back above the value area low, a level used in volume-based analysis to gauge buyer participation.
If $78 holds, the next upside target is $88. That level aligns with prior distribution zones and would represent a meaningful recovery from current levels.
On the upside beyond that, resistance sits at $92 and then $95. A close above $85 would be required first to open the door to those levels.
BSOL ETF Sees Inflows Despite Price Drop
On the institutional side, Bitwise’s Solana Staking ETF (BSOL) recorded $3,048,570 in net inflows on February 23, 2026.
That brings the fund’s total assets under management to $490,255,220. The inflow represents about 0.62% of AUM in a single day.
This came despite SOL being down roughly 41% over the past three months. The short-term technical signal on SOL-USD was flashing a Strong Sell rating at the time.
If SOL fails to break above $82, initial downside support sits at $80, then $79. A break below $79 could send the price back toward $77 or even $74.
SOL was trading at $76.57 at the time of the BSOL inflow report on February 23.
The post Solana (SOL) Price: Buyers Step In at Critical Level While ETF Investors Add Exposure appeared first on CoinCentral.
Ayrıca Şunları da Beğenebilirsiniz

Why $61,359 Just Became The Most Important Bitcoin Price Point

Tether makes strategic investment in Whop, a global internet marketplace platform.
