

Claude AI Predicts the Price of XRP and Solana If the U.S.–Iran War Escalates Further
The cryptocurrency market was already under pressure heading into late February 2026, and then the news broke. The United States, coordinating with Israel under what officials called Operation Shield of Judah, launched what President Donald Trump described as “major combat operations” against Iran on February 27 and 28.
Strikes hit Tehran, Isfahan, Qom, Karaj, and Kermanshah, targeting missile facilities, naval forces, and nuclear infrastructure. Iran closed its airspace and Israel declared a state of emergency. The region held its breath, and crypto markets responded almost immediately with sharp red candles across the board.
This is not a normal market as the backdrop matters enormously here.
Why Geopolitical Escalation Hits Crypto Markets Hard
The U.S.–Iran conflict did not begin overnight. Decades of tension, stretching from the 1953 U.S.-backed coup against Prime Minister Mohammad Mossadegh all the way through the 1979 hostage crisis, the collapse of the JCPOA nuclear deal, and years of escalating sanctions, have kept this relationship on a knife’s edge.
The February 2026 strikes represent a dramatic crossing of a threshold that many had hoped would never come. When that kind of uncertainty floods the global stage, investors in risk assets, including crypto, tend to move toward safety quickly.
The question worth examining now is straightforward: what happens to SOL and XRP if this conflict escalates further?
Solana Price Faces a Dangerous Technical Setup Heading Into Escalation
SOL was already in rough shape before the war headlines dropped. The price sits at $79, which is well below the 7-day SMA of $82.94, the 30-day SMA of $88.74, and drastically below the 200-day SMA of $158.01.
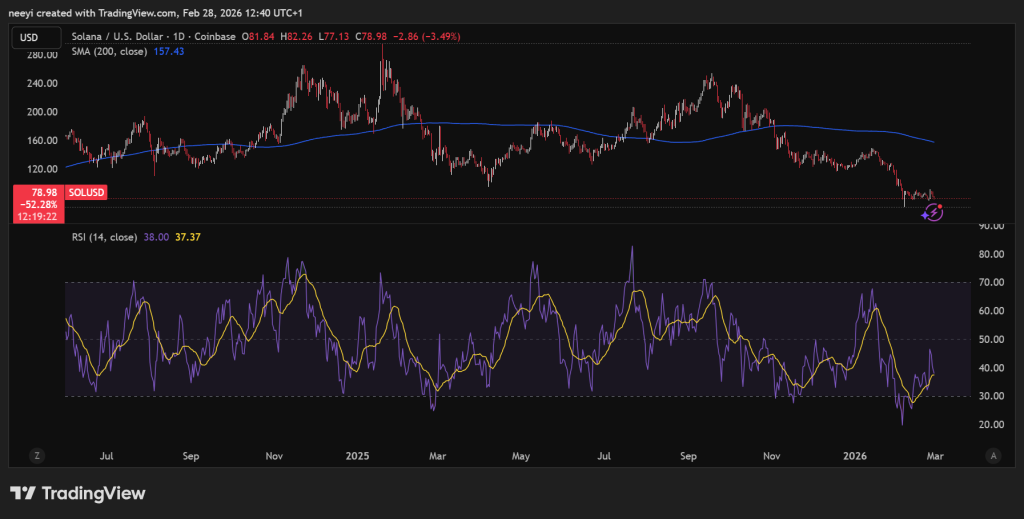 SOL Price Chart
The RSI sits at 40.61, which shows weak momentum without yet being deeply oversold. The MACD histogram is mildly positive at 1.65, hinting at a very fragile short-term stabilization attempt, but that stabilization story collapses quickly if geopolitical risk intensifies.
| Metric | Value |
|---|---|
| Price | $79.29 |
| 24h Change | -6.46% |
| 7d Change | -7.28% |
| 30d Change | -35.43% |
| 1y Change | -39.91% |
| Market Cap | $45.16B |
| 24h Volume | $4.53B |
| Drawdown from ATH | ~73% below |
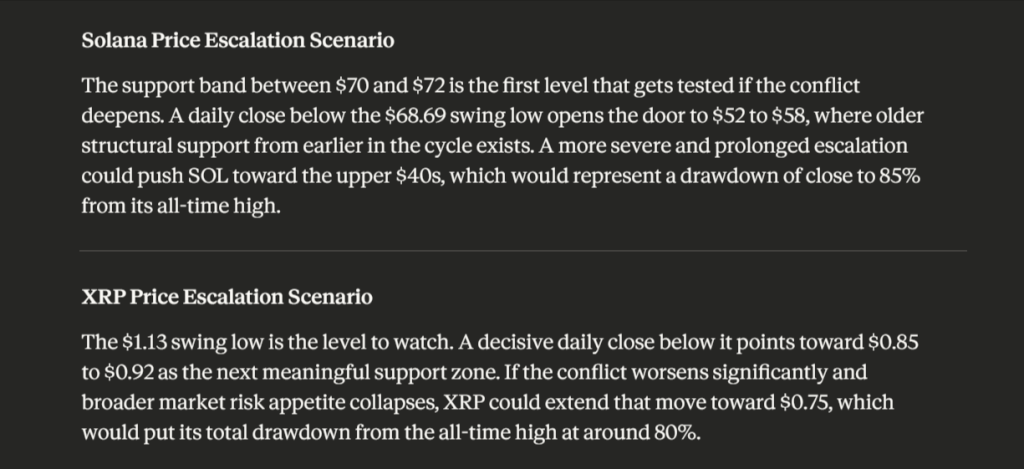
The key support band to watch sits between $70 and $72, just above the recent swing low of $68.69. That level is the last real floor before things get worse.
Under normal market conditions, a bounce from that zone would be plausible. Under a full-scale U.S.–Iran escalation scenario, that floor could crack. A decisive daily close below $68.69 removes an important structural support and opens the door to a fresh leg lower, potentially toward the low $50s or even the upper $40s if panic selling and risk-off sentiment take hold across broader markets.
The $90 to $100 resistance zone, formed by Fibonacci retracements and reinforced by the 30-day SMA at $88.74, becomes a distant target in this scenario. The SOL price would need a complete reversal in macro sentiment to reclaim that zone. An escalating war makes that outcome far less likely in the near term.
 Claude AI’s Reply
XRP Price Looks Vulnerable as Bearish Pressure Mounts
XRP at $1.30 is sitting directly on a 78.6% Fibonacci retracement level, which under normal circumstances could act as a short-term base. The problem is that the broader trend picture offers little comfort. XRP trades below the 7-day SMA of $1.39, the 30-day SMA of $1.46, and far below the 200-day SMA of $2.29.
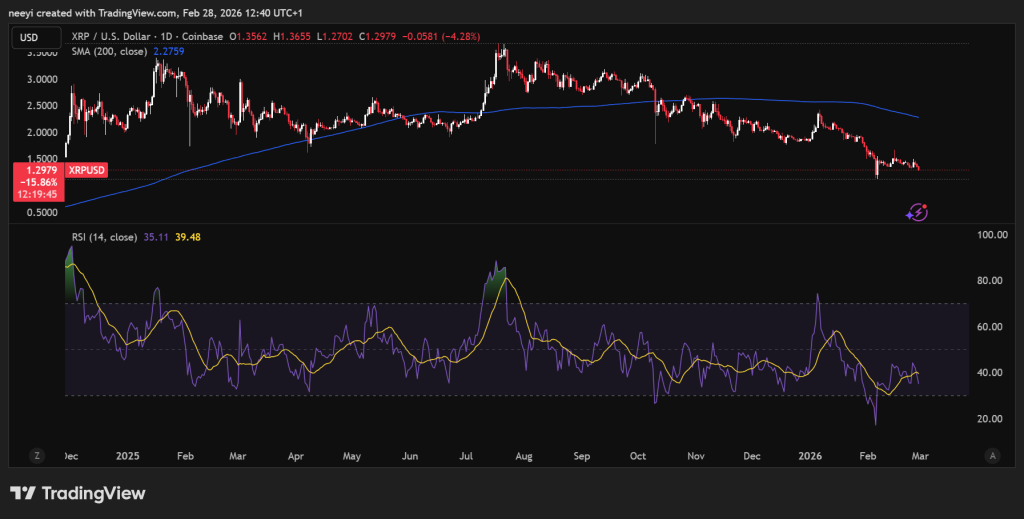 XRP Price Chart
The RSI of 35 leans toward oversold territory without being a full washout, and the MACD histogram is only marginally positive, which means downside momentum is slowing but not reversing.
| Metric | Value |
|---|---|
| Price | $1.30 |
| 24h Change | -7.15% |
| 7d Change | -10.10% |
| 30d Change | -30.73% |
| 1y Change | -36.37% |
| Market Cap | $79.12B |
| 24h Volume | $3.96B |
| Drawdown from ATH | ~66% below |
The critical level to watch for XRP is $1.13. That swing low is the last meaningful support before the technical picture deteriorates significantly.
Under a scenario where the U.S.–Iran war escalates, breaking $1.13 with volume and follow-through becomes a real risk. A close below that level could push XRP toward the $0.85 to $0.95 range, a scenario that seemed unlikely just weeks ago.
The resistance zone between $1.43 and $1.52 remains the benchmark for any bullish recovery. That zone aligns with the 30-day SMA and multiple Fibonacci levels, making it a dense overhead ceiling. The XRP price would need a significant shift in macro conditions to reclaim and hold that zone, and an escalating conflict makes that road considerably harder to travel.
Read Also: Grok AI Predicts the Price of XRP, Ethereum, and Shiba Inu By the End of 2026
The base case for both SOL and XRP was already cautious before this conflict intensified. Escalation stacks an additional layer of selling pressure on top of an already bearish technical structure. Historically, periods of major geopolitical conflict push investors toward liquidity and safety, and crypto markets tend to feel that pressure acutely, especially when assets are already in established downtrends.
Subscribe to our YouTube channel for daily crypto updates, market insights, and expert analysis.
The post Claude AI Predicts the Price of XRP and Solana If the U.S.–Iran War Escalates Further appeared first on CaptainAltcoin.
Ayrıca Şunları da Beğenebilirsiniz

Unlocking Latent Knowledge: Shrikrishna Joisa on the Future of OpenSpeechAI

Polygon Tops RWA Rankings With $1.1B in Tokenized Assets
