Solana (SOL) Price: Token Holds Support as Chart Signals Line Up for Potential Rally
TLDR
- SOL dropped below $88 after failing to hold above $90, but is finding support around $85
- RSI sits at 47.68 — neutral, with no strong buy signal yet
- SOL reclaimed the Ichimoku cloud on the 4-hour chart for the first time since January
- Analysts are watching $88.60 as the key breakout level; a break above could push toward $95–$100
- The 50MA crossed back above the 100MA, signaling a short-term momentum shift
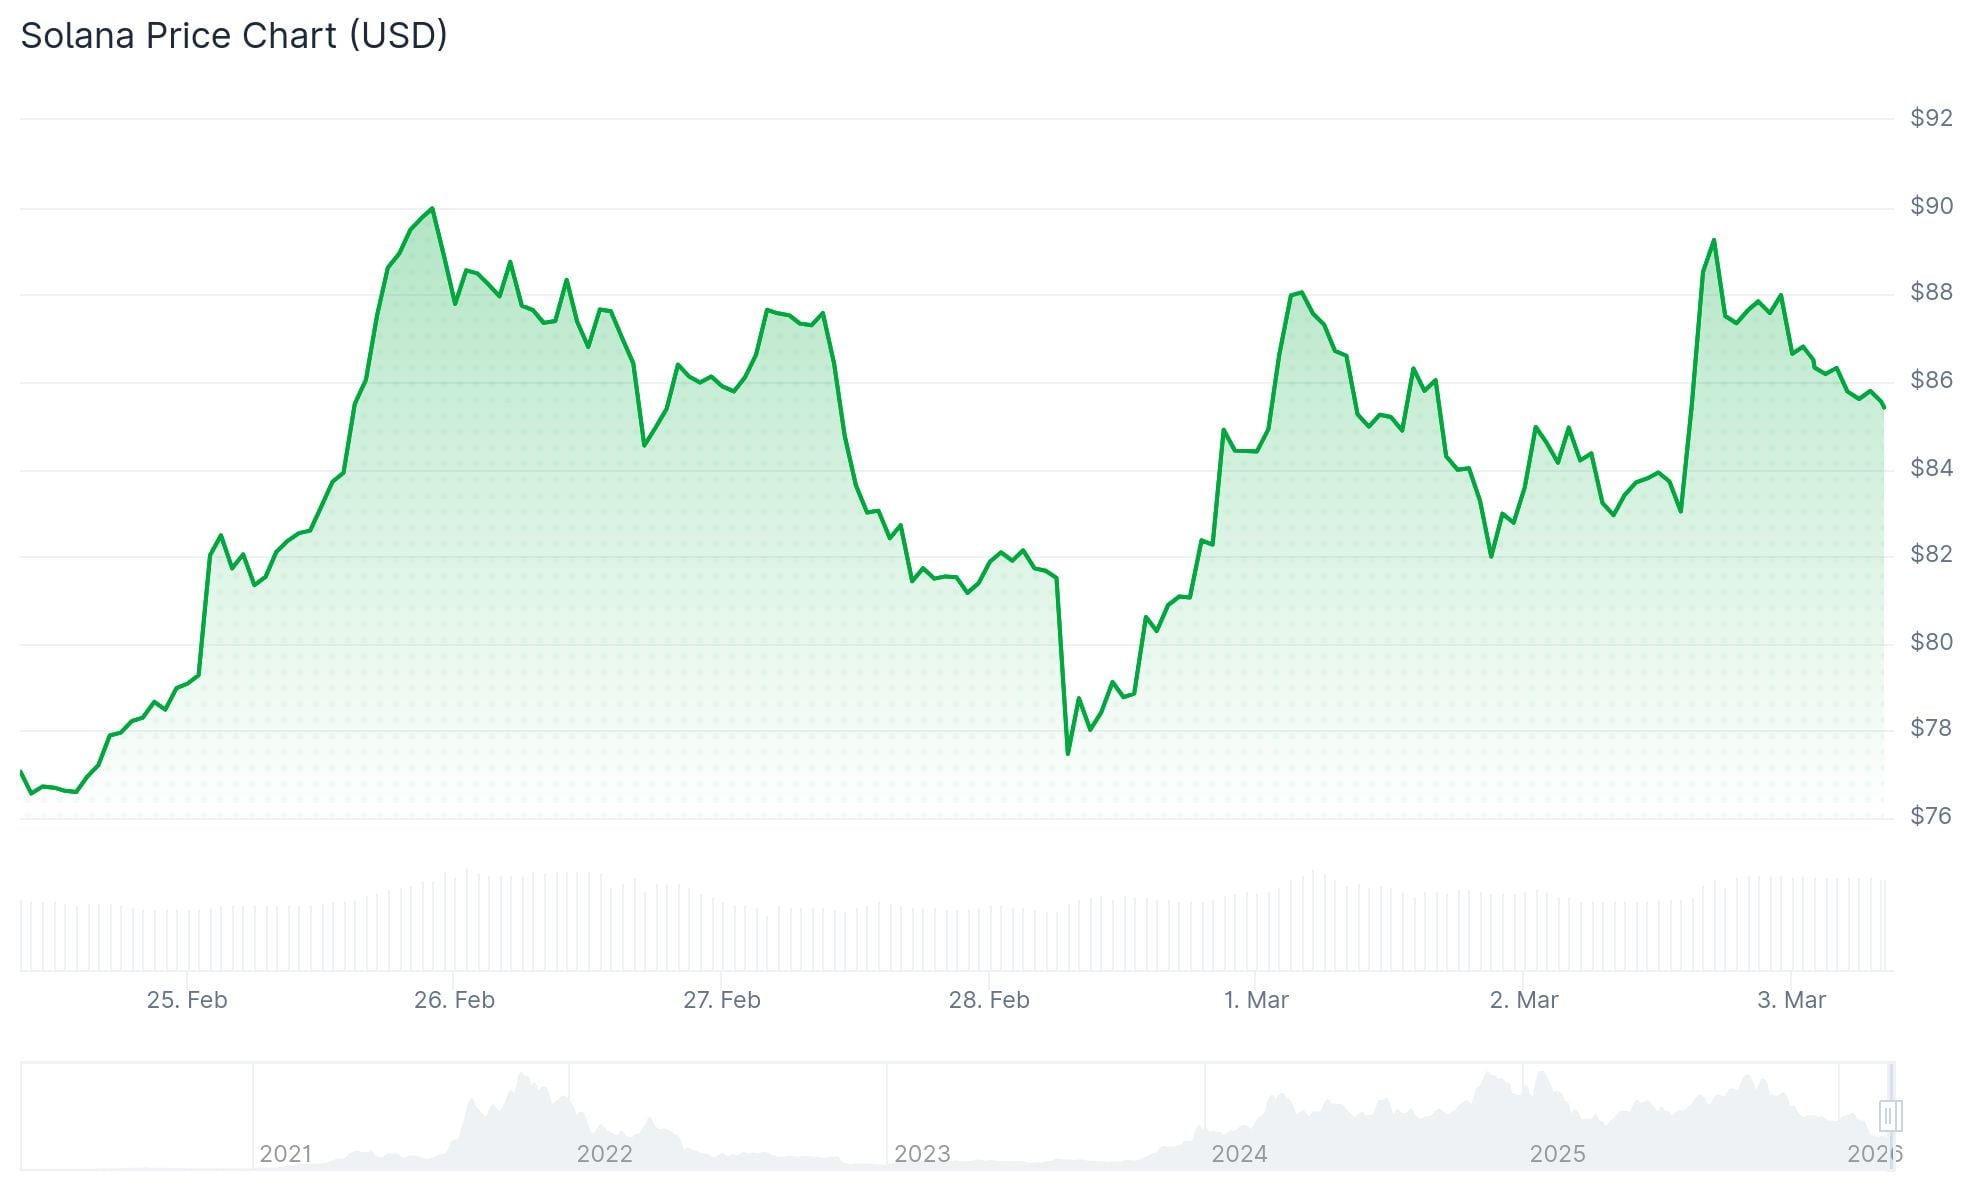
Solana (SOL) is trading around $87–$88 after pulling back from a recent high of $90.29. The price dipped below both $88 and $87 before finding footing above the $85 support level.
 Solana (SOL) Price
SOL is now holding above the 100-hourly simple moving average. The 24-hour trading volume sits at $9.99 billion, with a market cap of $49.91 billion. The price is up 4.70% over the past 24 hours.
The current pullback took price below the 50% Fibonacci retracement of the move from $81.71 to $90.29. A bullish trend line is forming on the hourly chart with support near $85, which also lines up with the 61.8% Fib level.
Market analyst BitGuru noted on March 2 that SOL may have exited its corrective phase and entered consolidation. He pointed to higher lows forming near a defined support zone as evidence of weakening selling pressure.
Analysts are watching $88.60 as the first key level to reclaim. Market commentator More Crypto Online said a move above the Sunday high at $88.60 would signal buyers are regaining control.
Key Resistance Levels to Watch
Resistance sits at $88, then $90, and $92. A close above $92 could open the path toward $96 and then $100.
If SOL fails to break above $90, the next downside levels are $84, then $82. A close below $82 could send price toward $76.50.
The RSI is at 47.68 — in the neutral zone. The MACD is at 1.80, slightly positive, but still below the signal line at -4.29. Bears are easing, but bulls have not taken full control.
Solana is trading well below its longer-term moving averages. The 50-day SMA is at $103.66, the 100-day at $117.73, and the 200-day at $156.34.
Ichimoku Cloud Break Signals Shift
On the 4-hour chart, SOL moved back above the Ichimoku cloud for the first time since January. Throughout February, every rally stalled below that cloud structure.
The 50-period moving average also crossed back above the 100-period moving average on the 4-hour chart. Analyst CryptoCurb described this as a structural change in trend conditions.
Both moving averages have begun turning upward. A chart projection shared by CryptoCurb points toward a potential move to $100 and beyond, contingent on price holding above the reclaimed levels.
For now, SOL is trading at $87.64 with early recovery signals present but no confirmed trend reversal yet.
The post Solana (SOL) Price: Token Holds Support as Chart Signals Line Up for Potential Rally appeared first on CoinCentral.
Ayrıca Şunları da Beğenebilirsiniz

Here’s How Much $100, $500, and $1,000 in Little Pepe (LILPEPE) Will Be Worth if the Price Hits $3 in 2026
First U.S. Dogecoin ETF Blasts $6 Million Volume Surge in First Hour