Flare Network (FLR) edges higher by less than 1% at press time on Wednesday after three consecutive days of trading in the red. The minor recovery aligns with the launch of the FAssets Incentive Program, which includes 2.2 billion FLR tokens.Flare Network (FLR) edges higher by less than 1% at press time on Wednesday after three consecutive days of trading in the red. The minor recovery aligns with the launch of the FAssets Incentive Program, which includes 2.2 billion FLR tokens.

Flare eyes further losses as assets incentive program launch goes muted

2025/07/02 15:35
  • Flare edges higher after three consecutive days of losses, signaling a potential downfall from a key resistance trendline.
  • Flare launches an incentive program with 2.2 billion FLR to boost institutional adoption of DeFi.
  • The technical outlook indicates a bearish tilt as the Flare network continues its declining trend.

Flare Network (FLR) edges higher by less than 1% at press time on Wednesday after three consecutive days of trading in the red. The minor recovery aligns with the launch of the FAssets Incentive Program, which includes 2.2 billion FLR tokens. Despite a growth in the fundamental roadmap, the technical outlook for FLR remains bearish. 

Flare Network launches FAssets Incentive Program 

Flare supports cryptocurrencies without smart contract capabilities, such as XRP, Bitcoin (BTC), and Dogecoin (DOGE), through FAssets. In an attempt to boost DeFi adoption of FAssets at an institutional level, Flare announced on Tuesday the launch of the FAssets Incentive Program. 

The incentive program offers 2.2 billion FLR tokens for protocols, assets, and pools based on their impact on Flare’s Total Value Locked (TVL) between July 2025 and July 2026.

https://x.com/FlareNetworks/status/1940048566166462524

Flare struggles to surpass a key resistance trendline

Flare network edges higher by less than 1% at press time on Wednesday, following a 3% drop the previous day. The pullback continues to respect a long-standing resistance trendline formed by connecting the peaks of December 2, January 18, June 2, and June 11. 

A potential daily close below the 23.6% Fibonacci level at $0.016, drawn from $0.035 on December 3 to $0.011 on April 8, could extend its decline to the June 22 low at $0.015.

The Moving Average Convergence/Divergence (MACD) indicator on the daily chart shows the MACD line inching closer to its signal line, almost crossing below it, which would provide a sell signal.

The Relative Strength Index (RSI) hovers around 43, below the halfway line, indicating that bears still have the upper hand. 

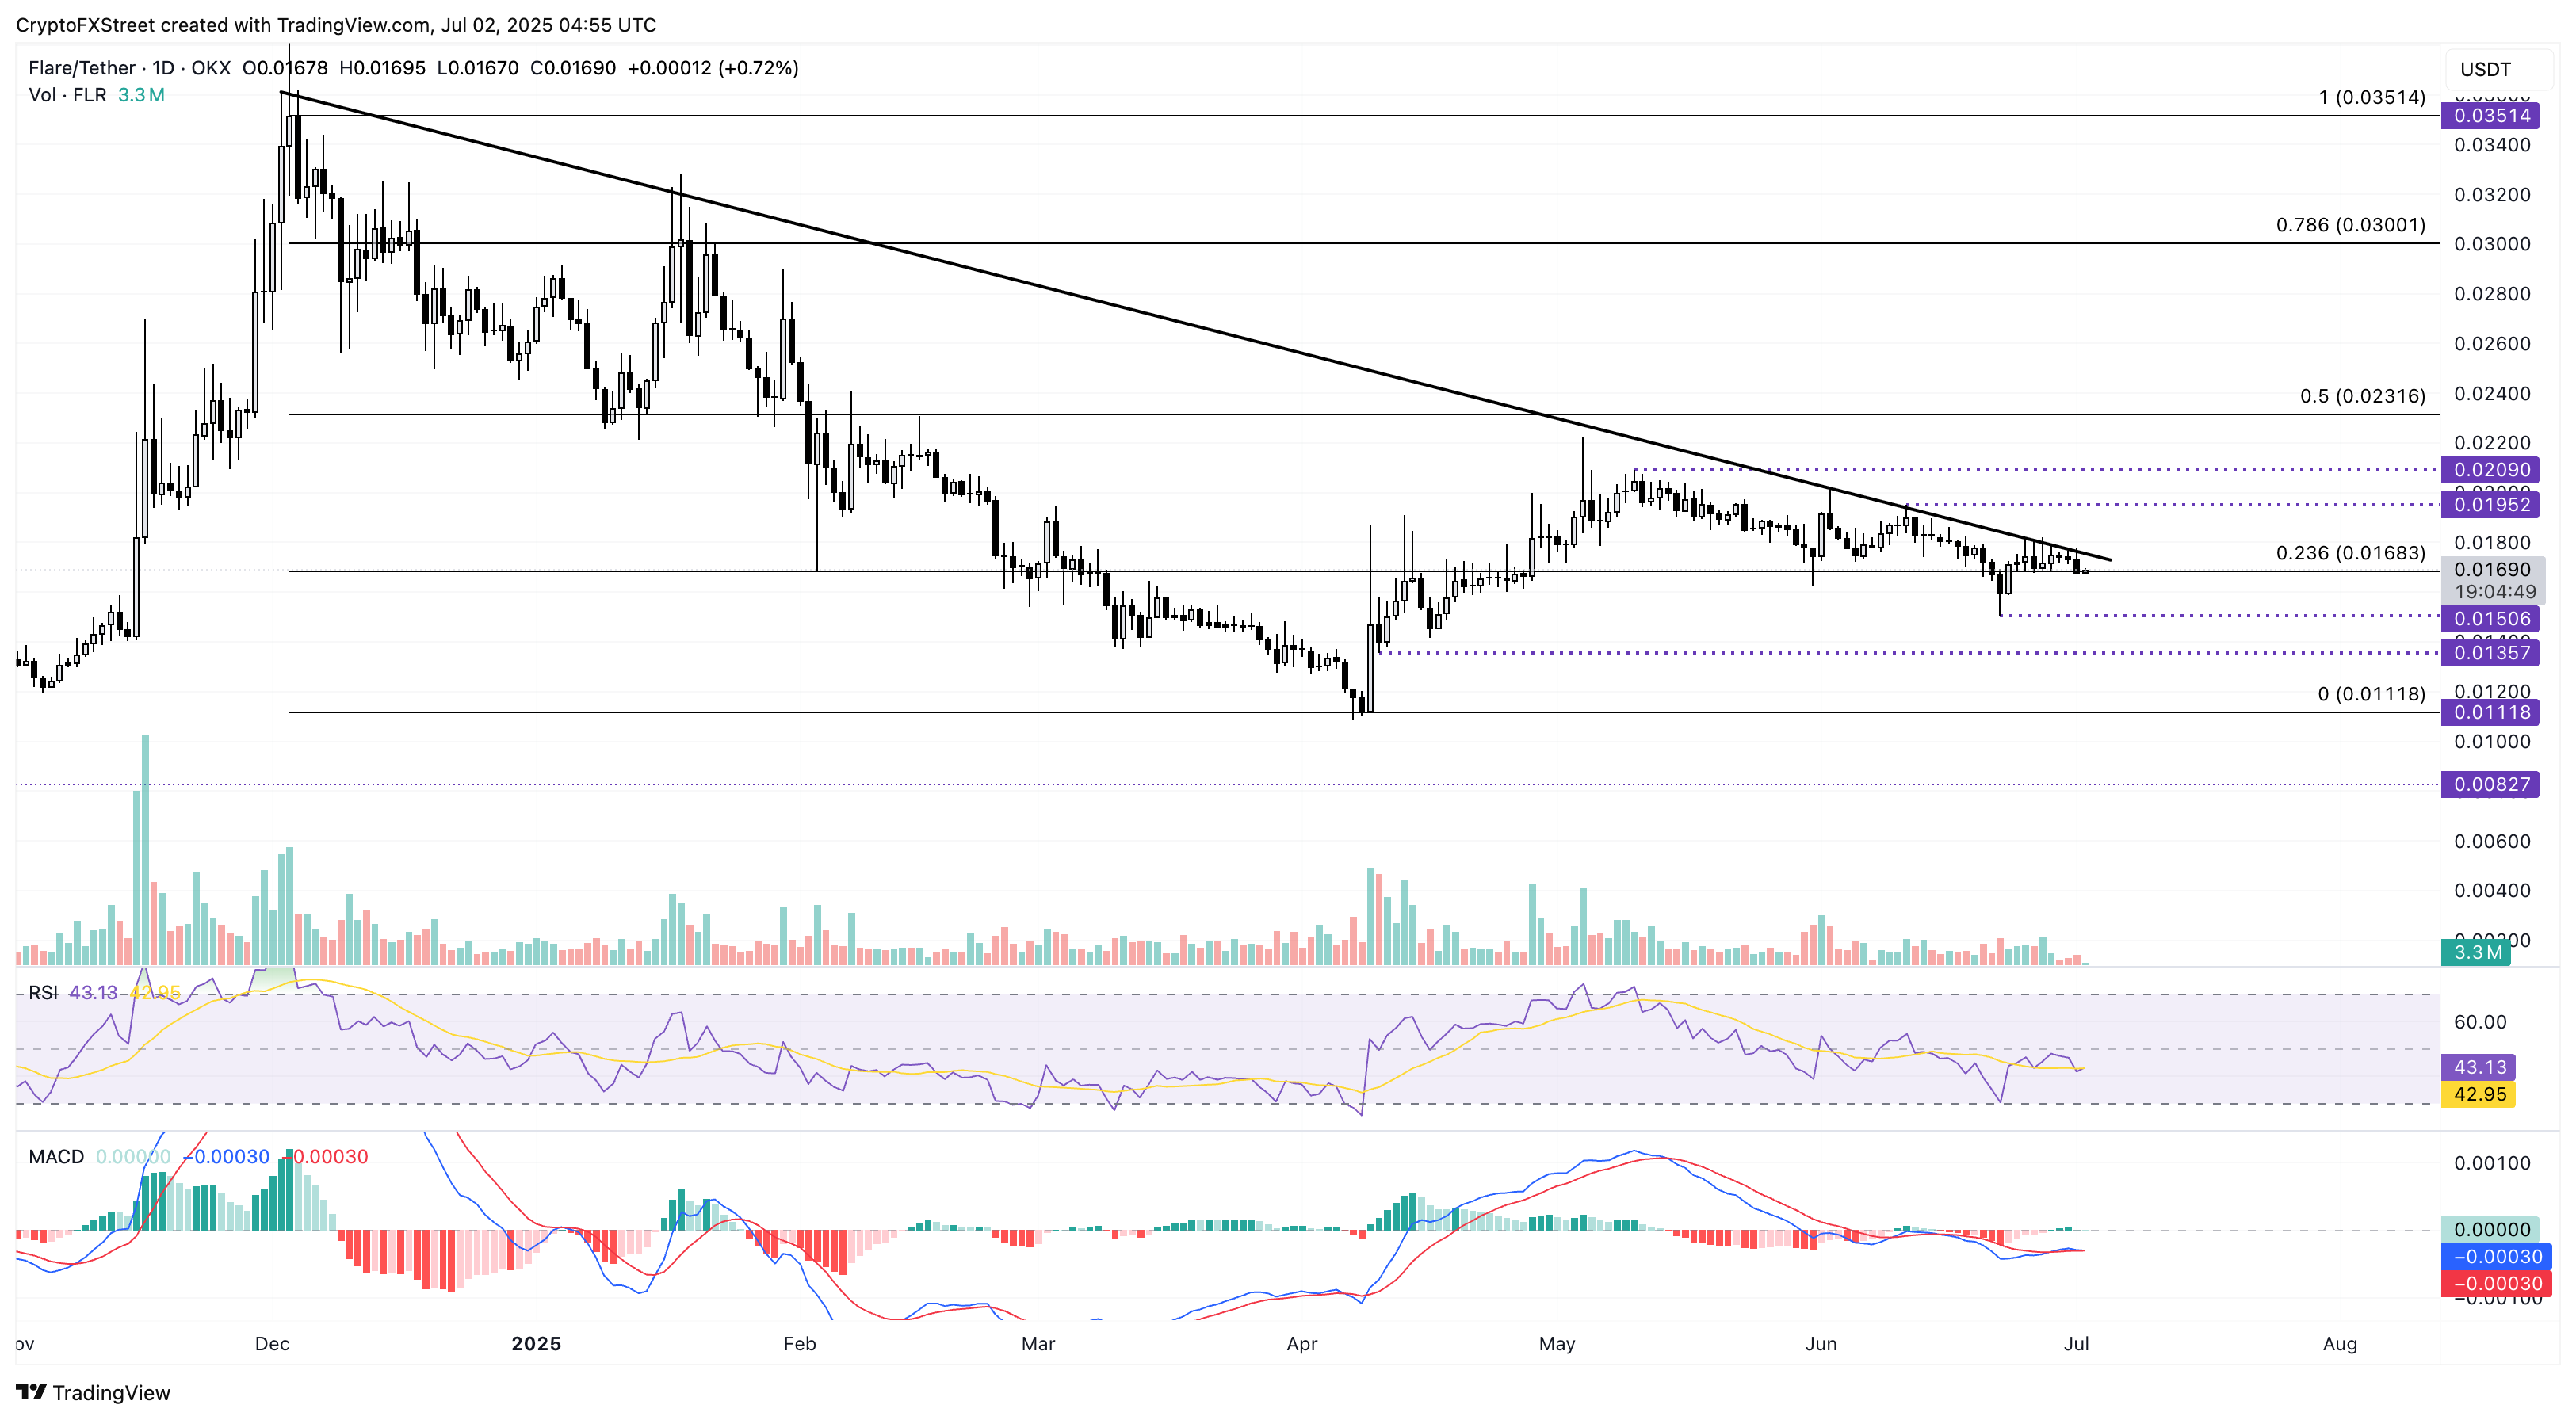
FLR/USDT daily price chart.

To reestablish an uptrend, Flare should close above the resistance trendline near Tuesday’s high at $0.017. In such a situation, FLR could extend its recovery towards $0.019, the high of June 11.


Piyasa Fırsatı
Flare Logosu
Flare Fiyatı(FLR)
$0.01149
$0.01149$0.01149
+1.77%
USD
Flare (FLR) Canlı Fiyat Grafiği
Sorumluluk Reddi: Bu sitede yeniden yayınlanan makaleler, halka açık platformlardan alınmıştır ve yalnızca bilgilendirme amaçlıdır. MEXC'nin görüşlerini yansıtmayabilir. Tüm hakları telif sahiplerine aittir. Herhangi bir içeriğin üçüncü taraf haklarını ihlal ettiğini düşünüyorsanız, kaldırılması için lütfen [email protected] ile iletişime geçin. MEXC, içeriğin doğruluğu, eksiksizliği veya güncelliği konusunda hiçbir garanti vermez ve sağlanan bilgilere dayalı olarak alınan herhangi bir eylemden sorumlu değildir. İçerik, finansal, yasal veya diğer profesyonel tavsiye niteliğinde değildir ve MEXC tarafından bir tavsiye veya onay olarak değerlendirilmemelidir.

Ayrıca Şunları da Beğenebilirsiniz

ArtGis Finance Partners with MetaXR to Expand its DeFi Offerings in the Metaverse

ArtGis Finance Partners with MetaXR to Expand its DeFi Offerings in the Metaverse

By using this collaboration, ArtGis utilizes MetaXR’s infrastructure to widen access to its assets and enable its customers to interact with the metaverse.
Paylaş
Blockchainreporter2025/09/18 00:07
MAXI DOGE Holders Diversify into $GGs for Fast-Growth 2025 Crypto Presale Opportunities

MAXI DOGE Holders Diversify into $GGs for Fast-Growth 2025 Crypto Presale Opportunities

Presale crypto tokens have become some of the most active areas in Web3, offering early access to projects that blend culture, finance, and technology. Investors are constantly searching for the best crypto presale to buy right now, comparing new token presales across different niches. MAXI DOGE has gained attention for its meme-driven energy, but early [...] The post MAXI DOGE Holders Diversify into $GGs for Fast-Growth 2025 Crypto Presale Opportunities appeared first on Blockonomi.
Paylaş
Blockonomi2025/09/18 00:00
Edges higher ahead of BoC-Fed policy outcome

Edges higher ahead of BoC-Fed policy outcome

The post Edges higher ahead of BoC-Fed policy outcome appeared on BitcoinEthereumNews.com. USD/CAD gains marginally to near 1.3760 ahead of monetary policy announcements by the Fed and the BoC. Both the Fed and the BoC are expected to lower interest rates. USD/CAD forms a Head and Shoulder chart pattern. The USD/CAD pair ticks up to near 1.3760 during the late European session on Wednesday. The Loonie pair gains marginally ahead of monetary policy outcomes by the Bank of Canada (BoC) and the Federal Reserve (Fed) during New York trading hours. Both the BoC and the Fed are expected to cut interest rates amid mounting labor market conditions in their respective economies. Inflationary pressures in the Canadian economy have cooled down, emerging as another reason behind the BoC’s dovish expectations. However, the Fed is expected to start the monetary-easing campaign despite the United States (US) inflation remaining higher. Investors will closely monitor press conferences from both Fed Chair Jerome Powell and BoC Governor Tiff Macklem to get cues about whether there will be more interest rate cuts in the remainder of the year. According to analysts from Barclays, the Fed’s latest median projections for interest rates are likely to call for three interest rate cuts by 2025. Ahead of the Fed’s monetary policy, the US Dollar Index (DXY), which tracks the Greenback’s value against six major currencies, holds onto Tuesday’s losses near 96.60. USD/CAD forms a Head and Shoulder chart pattern, which indicates a bearish reversal. The neckline of the above-mentioned chart pattern is plotted near 1.3715. The near-term trend of the pair remains bearish as it stays below the 20-day Exponential Moving Average (EMA), which trades around 1.3800. The 14-day Relative Strength Index (RSI) slides to near 40.00. A fresh bearish momentum would emerge if the RSI falls below that level. Going forward, the asset could slide towards the round level of…
Paylaş
BitcoinEthereumNews2025/09/18 01:23