

Expectations of interest rate cuts are intertwined with valuation concerns. BTC will continue its fourth wave of growth after the upward relay.
Author: 0xWeilan
Affected by the U.S. economic and employment data, expectations for restarting interest rate cuts are fluctuating, the inflow and outflow of main pricing funds are fluctuating, and coupled with cross-cycle long-term selling and on-site fund rotation, the overall crypto market in August showed a "weak-to-strong-then-weak" trend, and prices showed an "arch" shape.
BTC fell 6.49% for the month, closing at $108,247.95. Ethereum, a representative altcoin, surged 18.75% to close at $4,391.83.
According to eMerge Engine, BTC is currently in the late stages of a bull market. In our June report, we predicted that BTC would embark on its fourth upward trend in the third quarter, reaching a new all-time high. This prediction was confirmed in July. In August, the impact of the "reciprocal tariff war" began to show up in US economic data, with both CPI and PCE rebounding. This has repeatedly dampened market expectations for a resumption of interest rate cuts in September, causing volatility in the US stock market, which had overpriced in the resumption of rate cuts. This volatility was transmitted to the crypto market through the Crypto Spot ETF, causing BTC, which had reached a record high in mid-month, to ultimately price downward, a typical rebalancing of risk appetite.
During this period of volatility, capital outflows were not continuous, appearing to be hesitant. Overall, BTC still received $329 million in inflows this month. The fundamental cause of the price drop was cross-cycle long-term selling and sector rotation within the crypto market.
The massive sell-off by whales locked in profits and drained scarce liquidity. Meanwhile, billions of dollars flowed from BTC to ETH both on and off the exchange. EMC Labs believes this contributed to BTC's price plummeting back to the "Trump bottom" of $90,000-110,000 after reaching a record high.
The market has essentially repriced in its interest rate cut expectations, with the implied price being a September rate cut, the second 50 basis point cut this year. However, with several economic, employment, and inflation data still to be released before September 17th, the market is expected to remain volatile.
However, with the resumption of interest rate cuts, a "soft landing" for the US economy driven by AI capital expenditures and technology-driven growth, and a decline in employment data, but not to a worsening degree, this remains a high probability event. EMC Labs maintains a cautiously optimistic outlook for the September market, believing that after experiencing necessary short-term fluctuations, BTC will continue its fourth wave of growth.
Macro-finance: "Inflation rebound" and "employment cooling" pull interest rate cut expectations
In August, the US capital market was primarily driven by the oscillation of three variables: economic and inflation data, expectations of when the Federal Reserve would resume rate cuts, and concerns about the Fed's independence. The overall market trend was characterized by a period of cooling, then heating, and then cooling again.
On August 1st, employment data was released. The U.S. unemployment rate rose month-over-month in July, with non-farm payrolls increasing by 73,000 jobs, far below the previously expected 100,000. Meanwhile, the Bureau of Labor Statistics significantly revised downward its May and June data, with the June revision exceeding 90%.
Following the release of this surprising data, the Nasdaq plummeted 2.24% that day, with BTC following suit, falling 2.17%. Influenced by the data, FedWatch showed that the probability of the Federal Reserve cutting interest rates by 25 basis points in September rose sharply from 37.7% the previous day to 75.5%.
The US dollar index fell 1.23% that day and continued its downward trend. This data rekindled market expectations of a September rate cut. US stocks and Bitcoin subsequently continued to rise, with Bitcoin hitting a record high of $124,533.00 on August 14.
On August 12, the US CPI data released was in line with market expectations and had no significant impact on the market. However, the market, which has fully priced in interest rate cuts, remains highly sensitive to inflation data.
On August 14th, the Producer Price Index (PPI) data was released, showing an annualized growth of 3.3%, significantly exceeding market expectations of 2.5%. Concerns that rising production costs would eventually be passed on to consumers initially dampened market expectations for interest rate cuts. After hitting a record high, BTC began to decline, continuing its decline until the end of the month. During the same period, the tech-heavy Nasdaq began to weaken, with funds shifting from highly valued tech stocks to cyclical and consumer stocks, and the Dow Jones began to strengthen. This suggests that expectations for rate cuts have not been shattered, but rather that expectations have been adjusted downward, prompting investors to seek out assets with safer valuations.
On August 20th, at the Jackson Hole Global Central Bank Conference, Federal Reserve Chairman Powell delivered his most dovish tone yet this year, suggesting the Fed will pay more attention to the cooling job market and potentially cut interest rates to stimulate a recovery. This reassured the market, with traders pricing in a September rate cut probability exceeding 70% until the end of the month.
The core PCE data released on August 29th, while largely in line with expectations, recorded an annualized 2.9% increase, the highest since February 2025, indicating a slight increase in underlying inflationary pressures. All three major U.S. stock indices fell, but the Dow Jones Industrial Average's drop was significantly smaller than the Nasdaq's.
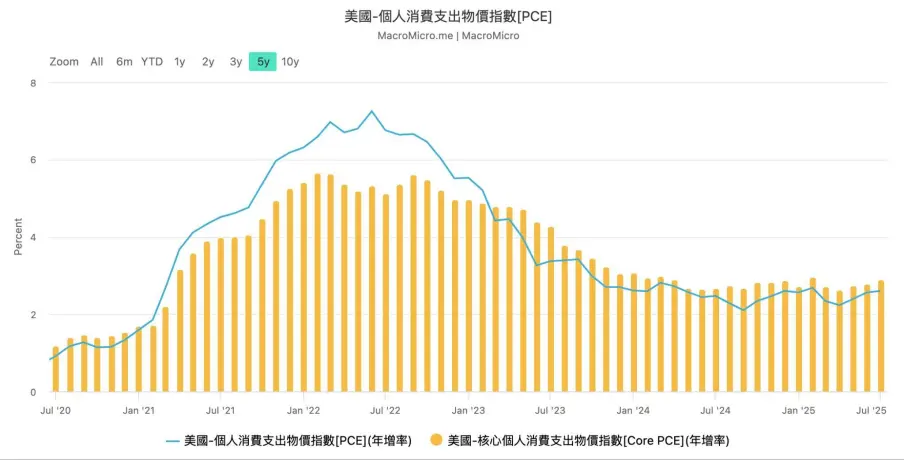
US PCE index annual rate
By the end of the month, the market had fully priced in “restarting interest rate cuts in September, twice this year, for a total of 50 basis points.”
President Trump has been escalating pressure on the Federal Reserve to cut interest rates. At the end of the month, he announced on social media that he was firing Fed Governor Lisa Cook, who had advocated against a rate cut, for allegedly falsifying mortgage documents. This incident further heightened market concerns about the Fed's independence.
Crypto assets: BTC returns to the "Trump bottom", ETH inflows hit a record high
In August, BTC exhibited an arching trend. Suppressed by sharply downward revisions to employment data at the beginning of the month, it quickly resumed its upward trend, propelled by an over 80% probability of interest rate cuts, reaching a record high on August 14th. Following the release of PPI data on the 14th, the market continued its downward trend in the second half of the month.
Technically, BTC suffered a setback and returned to the "Trump bottom" (US$90,000-110,000), and temporarily broke the "first rising trend line" of this bull market and the important 120-day line.
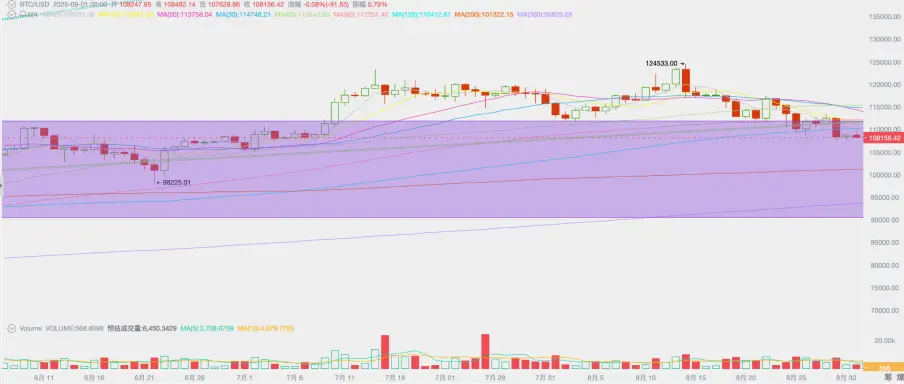
BTC price daily chart
On a monthly basis, after a four-month rebound, BTC retreated 6.49%, with trading volume shrinking slightly. This month's BTC price drop can be seen as a technical correction driven by a combination of a correction in overpricing and a shift in capital flows. We believe that with the resumption of the interest rate cut cycle and a shift in market risk appetite, mainstream capital will flow back into BTC, driving its fourth wave of growth in this cycle.
BTC's decline has generally tracked the Nasdaq and is related to expectations of interest rate cuts. It's generally believed that risky assets will continue to strengthen after the market enters a period of interest rate cuts. While BTC is also a highly volatile asset, within the crypto market, it is considered a more "blue chip" asset compared to altcoins.
As interest rate cuts approach and consensus on public chain assets strengthens, on- and off-exchange funds are flowing into ETH at an accelerated pace.
Capital Flow: ETH inflow exceeds BTC by over 10 billion
The total inflow of funds into the crypto market this month reached US$27.778 billion, including US$164.14 in stablecoins, 3.420 billion in ETH Spot ETF, 7.485 billion in ETH corporate purchases, 226 million in SOL ETF, and 1.505 billion in BTC corporate purchases, but the BTC Spot ETF saw an outflow of 1.176 billion.
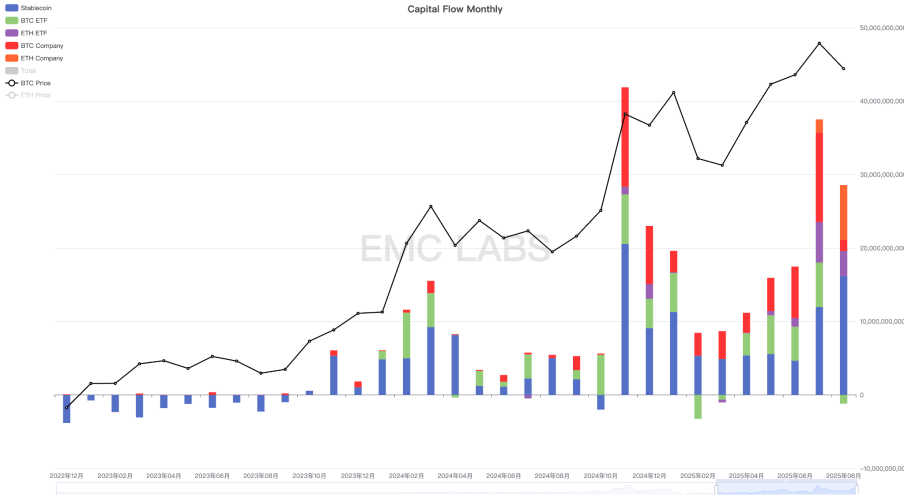
Crypto market capital inflow statistics (monthly)
Analyzing BTC's current main purchasing power, only $329 million has flowed into the BTC Spot ETF and corporate purchases, significantly lower than last month. This is the fundamental reason for BTC's weak performance this month.
Meanwhile, ETH Spot ETFs and corporate ETH purchases totaled $10.805 billion, a record high. EMC Labs believes there is a clear trend of funds flowing from BTC to ETH, both on- and off-exchange.
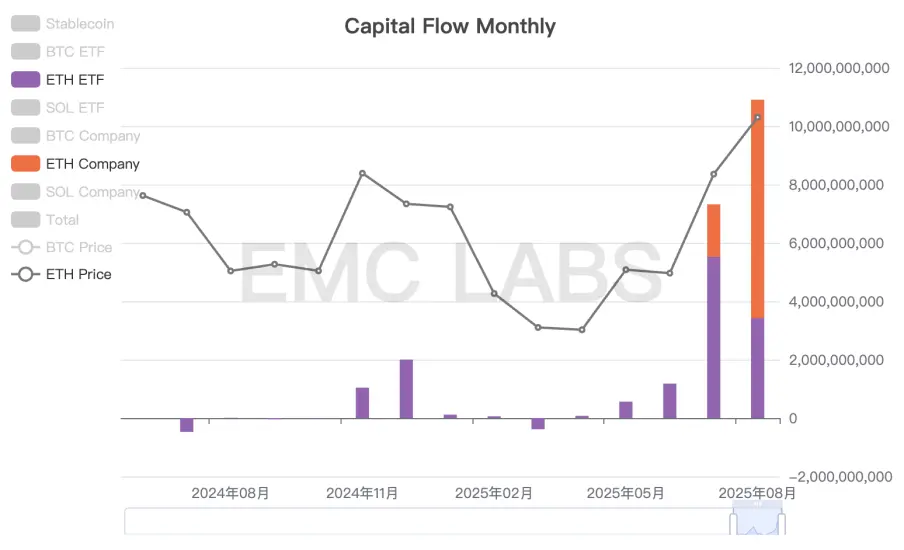
ETH capital inflow statistics (monthly)
There are three reasons for this. First, over the past few years, consensus on Bitcoin (BTC) has largely spread in major countries like the United States, leading to a surge in investment in the second-largest cryptocurrency, Ethereum (ETH). Second, as the United States enters a crypto-friendly era, the trend of transforming the traditional financial industry with blockchain technology has begun to emerge. As the native currency of the leading smart contract platform, ETH has begun to attract increasing attention and allocation from industry capital. Finally, BTC has already reached a record high during this cycle, while ETH has yet to surpass the peak of the previous bull market. This, coupled with the historical experience of the eventual Alt Season in a low-interest rate environment, has led to a surge in speculative capital into ETH, driving its price up rapidly.
With the resumption of the interest rate cut cycle, the ongoing repricing of risk, and the historical rate of altseason, we reported last month that altseason is underway. We now believe that ETH is in the mid-stage of price rediscovery within this cycle, with significant upside potential. With the resumption of interest rate cuts and increased risk appetite, a wider range of altcoins may experience rapid price increases driven by speculative buying.
Chip structure: The third wave of selling continues
In addition to capital rotation, another important reason for the divergence in BTC and ETH prices in August is that long-term investors across and within cycles have already initiated the third wave of selling in this cycle of BTC (there were only two waves of selling in previous bull markets).
In August, long-term investors accelerated their divestment, reducing their holdings by over 150,000 coins, including accounts from the Satoshi era that profited significantly. These divestments drained scarce inflows, pushing prices downward for rebalancing. Due to the sheer size of a single entity, the sell-off by these whales makes the significant selling figures somewhat contingent. Current long-term holdings remain higher than in February, and with liquidity strengthening, the sell-off is expected to continue.
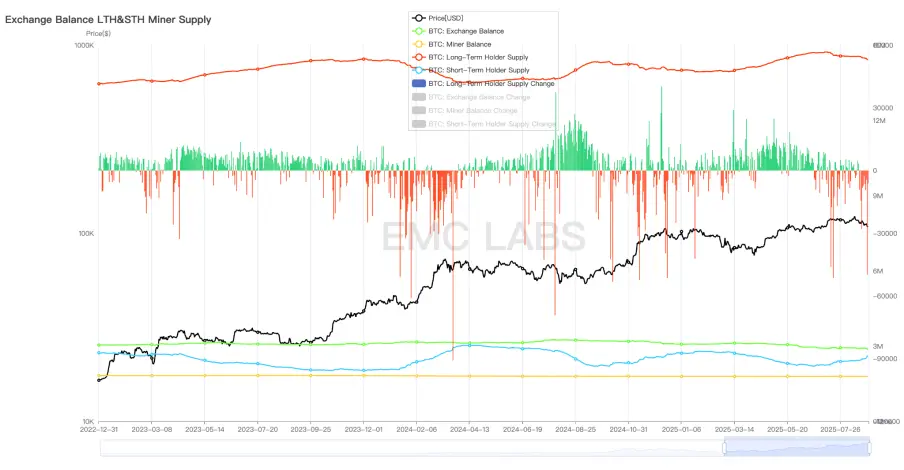
Statistics on long-term, short-term, miners, and centralized exchanges
From the perspective of exchanges, 38,620 BTC have flowed out this month, slightly less than last month, which is consistent with the characteristics of a bull market.
Conclusion
eMerge Engine shows that the BTC Metric is 0.375, and BTC is in an upward relay period.
We believe that with the massive influx of treasury firms, spot ETFs, and industrial capital, the crypto market has entered a new phase of mainstream development. For BTC, volatility will gradually decline, and its correlation with US stocks, particularly the Nasdaq, will strengthen. For smart contract platform assets like ETH and SOL, the influx of mainstream capital is just the beginning, and the spread of consensus will inevitably lead to repricing.
As we enter September, when interest rate cuts are about to begin, the market will not be smooth sailing. The high valuation of the US stock market and the independence of the Federal Reserve are still plaguing the market.
But the cycle will continue.
Ayrıca Şunları da Beğenebilirsiniz

Fed forecasts only one rate cut in 2026, a more conservative outlook than expected

While Ethereum and Hedera Hold Steady, ZKP Crypto Shakes the Market with a $1.7B Raise in Motion
