


Understanding Sideways Markets
Sideways markets in cryptocurrency trading are defined by price movement within a confined range, lacking a clear upward or downward trend. For AI3, these phases are marked by reduced volatility and price oscillation between established support and resistance levels on the Autonomys Network[1].
You can identify when AI3 is trading in a range-bound pattern by observing consistent bounces between support and resistance on the Autonomys Network, typically accompanied by decreasing volume and muted price action[1].
Psychological factors such as trader indecision, market uncertainty, and anticipation of major news or events often contribute to the formation of sideways markets.
The duration of AI3 consolidation phases can vary, but historical patterns show that these periods often last from several days to a few weeks, depending on broader market sentiment and liquidity within the Autonomys Network ecosystem[1].
Example: In cryptocurrency trading, AI3 frequently enters sideways movements where price becomes confined within a specific range on the Autonomys Network. These consolidation phases are characterized by reduced volatility between defined support and resistance levels. For traders, identifying these patterns is crucial as they often precede significant breakout moves offering profitable opportunities. You can identify when AI3 is trading in a range-bound pattern by observing consistent bounces between support and resistance levels, typically with decreasing volume on the Autonomys Network. During February-March 2025, AI3 demonstrated classic sideways movement between $1.75 and $2.10 for nearly three weeks before a significant upward breakout[1].
Key Technical Indicators for Breakout Detection
Volume analysis is a leading indicator for potential AI3 breakouts on the Autonomys Network. A sustained decrease in volume during consolidation followed by a sharp spike often signals an imminent breakout[1][3].
Bollinger Bands help identify compression before AI3 breakouts; a 'squeeze' indicates reduced volatility and often precedes explosive price movements.
RSI divergence patterns can precede directional moves. Bullish divergence occurs when AI3 price forms lower lows while RSI forms higher lows, suggesting underlying buying pressure on the Autonomys Network.
Support and resistance levels are critical in identifying AI3 breakout zones. Price alerts set at these levels can help traders catch breakouts early.
Setting up price alerts for volume surges and key level breaks is essential for timely AI3 breakout trading on the Autonomys Network.
Example: Volume serves as a critical breakout indicator for AI3. A sustained volume decrease during consolidation followed by a significant spike often signals an imminent breakout on the Autonomys Network. For instance, AI3's April 2025 sideways trading showed a 50% decrease in average volume followed by a 3x surge that preceded a 15% upward movement[3]. Bollinger Bands compression indicates decreased volatility and often precedes explosive AI3 price movements on the Autonomys Network. Meanwhile, RSI divergence patterns can predict breakout directions—bullish divergence occurs when price forms lower lows while RSI forms higher lows, suggesting underlying buying pressure despite apparent weakness.
Chart Patterns That Signal Potential Breakouts
Triangle patterns (ascending, descending, and symmetrical) on AI3 charts often signal potential breakouts on the Autonomys Network. Ascending triangles typically indicate bullish breakouts, while descending triangles suggest bearish moves.
Rectangle and flag formations act as continuation patterns, signaling potential for further AI3 movement in the prevailing direction on the Autonomys Network.
Head and shoulders patterns serve as reversal indicators, often marking the end of an AI3 trend.
Cup and handle patterns on longer timeframes can signal bullish continuation after a period of AI3 consolidation on the Autonomys Network.
Double tops and double bottoms occur when AI3 price tests a level twice without breaking through, forming 'M' or 'W' shapes that often precede significant moves.
Example: Triangle patterns on AI3 charts offer valuable breakout signals on the Autonomys Network. Ascending triangles typically signal bullish breakouts, while descending triangles suggest bearish moves. During June 2025, AI3 formed a textbook ascending triangle before breaking upward for a 20% gain. Rectangle formations appear as horizontal trading ranges with parallel support/resistance lines, while cup and handle patterns form a rounded bottom followed by a short downward drift before breaking upward. Double tops and bottoms occur when price tests a level twice without breaking through, creating either an 'M' or 'W' shape that often precedes significant AI3 moves on the Autonomys Network.
Trading Strategies for AI3 Breakouts
The breakout confirmation strategy involves waiting for a strong volume surge, decisive candle close beyond the breakout level, and AI3 price holding position for at least 4 hours on the Autonomys Network.
The false breakout avoidance strategy uses time filters and multiple timeframe analysis to ensure the AI3 breakout is significant across various chart intervals.
Risk management techniques specific to AI3 breakout trading include strict stop-losses 1-2% below breakout levels, position sizing risking only 1-2% of capital per trade, and taking partial profits while moving stops to breakeven.
For take-profit targets, measure the AI3 consolidation pattern's height and project it from the breakout point on the Autonomys Network.
Position sizing should be conservative, especially in volatile AI3 conditions, to protect capital.
Example: For reliable AI3 breakout trading on the Autonomys Network, wait for confirmation through strong volume surge, decisive candle close beyond the breakout level, and price holding position for at least 4 hours. To avoid false breakouts, use time filters and multiple timeframe analysis to ensure the breakout is significant across various chart intervals. Risk management is crucial when trading AI3 breakouts. Implement strict stop-losses 1-2% below breakout levels, position sizing risking only 1-2% of capital per trade, and taking partial profits while moving stops to breakeven. For take-profit targets, measure the consolidation pattern's height and project it from the breakout point when trading AI3 on the Autonomys Network.
Practical Tools and Platforms for Breakout Trading
Set up effective AI3 chart layouts on MEXC with multiple timeframes, volume indicators, and Bollinger Bands to track Autonomys Network activity[1][3].
Configure scanner tools to identify potential AI3 breakout candidates by detecting low volatility levels, decreasing volume patterns, and price approaching key resistance on the Autonomys Network.
Use the MEXC mobile app for on-the-go AI3 breakout monitoring with real-time alerts, customizable watchlists, and full-featured charting[1].
Create custom indicators and alerts for AI3 volume surges, price breaks at key levels, and Bollinger Band contractions on the Autonomys Network.
Analyze order book data on MEXC to validate AI3 breakout strength by examining the depth of orders near potential breakout levels on the Autonomys Network[3].
Example: MEXC provides excellent tools for AI3 breakout trading on the Autonomys Network. Configure charts to display multiple timeframes, volume indicators with moving averages, and Bollinger Bands. Use the platform's scanner tools to identify potential breakout candidates by detecting low volatility levels, decreasing volume patterns, and price approaching key resistance. The MEXC mobile app enables on-the-go monitoring with real-time alerts, customizable watchlists, and full-featured charting for AI3 on the Autonomys Network. Create custom alerts for volume surges, price breaks at key levels, and Bollinger Band contractions. Additionally, MEXC's order book data helps validate breakout strength by revealing the depth of orders near potential breakout levels.
Conclusion
Effective AI3 breakout trading on the Autonomys Network combines technical analysis with strict risk management. Monitor key indicators while using appropriate stop-losses to protect your capital during volatile market conditions. For current AI3 analysis and breakout opportunities on the Autonomys Network, visit MEXC's AI3 Price page and trade with confidence using our comprehensive toolset designed for crypto traders[1][3][5].
Artikel-artikel yang dibagikan di halaman ini bersumber dari platform publik dan disediakan hanya sebagai referensi. Artikel tersebut tidak mewakili posisi atau pandangan MEXC. Seluruh hak merupakan milik MEXC. Jika Anda meyakini ada konten yang melanggar hak pihak ketiga, silakan hubungi [email protected] untuk penghapusan segera. MEXC tidak menjamin keakuratan, kelengkapan, atau keaktualan konten apa pun dan tidak bertanggung jawab terhadap segala tindakan yang dilakukan berdasarkan informasi yang diberikan. Konten tersebut bukan merupakan saran keuangan, hukum, atau profesional lainnya, serta tidak boleh ditafsirkan sebagai rekomendasi atau dukungan oleh MEXC. Untuk mendapatkan wawasan ahli dan analisis mendalam, kunjungi MEXC Learn.
Pelajari Gensyn Selengkapnya
Lihat Selengkapnya
Kesepakatan Nuklir Oklo dan Meta Dijelaskan: Proyek Daya Pusat Data AI 1,2 GW

Apa Itu Saham Oklo (NYSE: OKLO)? Pembangkit Listrik Tenaga Nuklir Aurora, Pusat Data AI, Strategi Bahan Bakar, dan Peluang Pertumbuhan

Apakah AI Inference Mengubah Siklus NAND? Apa Arti Sandisk bagi Saham Memory
Info Gensyn Terkini
Lihat Selengkapnya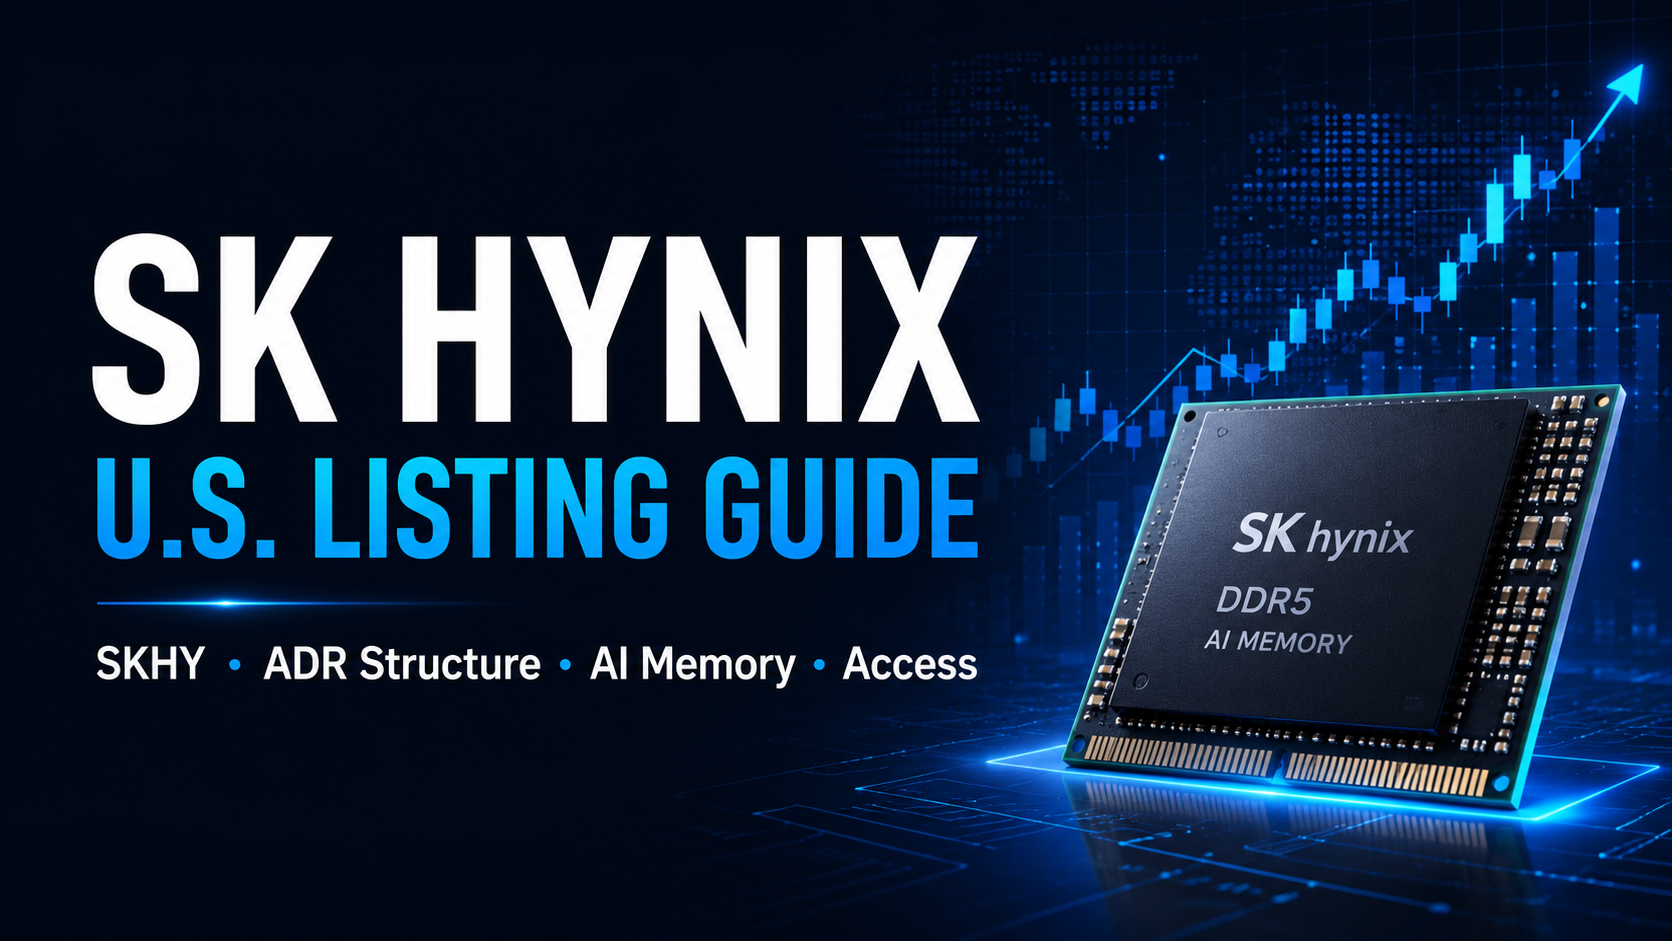
Panduan Pencatatan Saham SK Hynix di AS: Tanggal SKHY, Struktur ADR, Eksposur Memori AI, dan Akses MEXC

Laba Q2 Samsung Melonjak 19x Lipat, Namun Saham Anjlok: Mengapa Saham Memori AI Menghadapi Standar yang Lebih Tinggi

Tinjauan Pendapatan Apple Q2 FY2026: Pendapatan iPhone dan Pertumbuhan Layanan Menjaga Kisah EPS Tetap Utuh
POPULER
Mata uang kripto yang sedang tren saat ini dan menarik perhatian pasar yang signifikan
Harga Kripto
Mata uang kripto dengan volume trading tertinggi
Baru Ditambahkan
Mata uang kripto yang baru saja masuk listing dan tersedia untuk trading