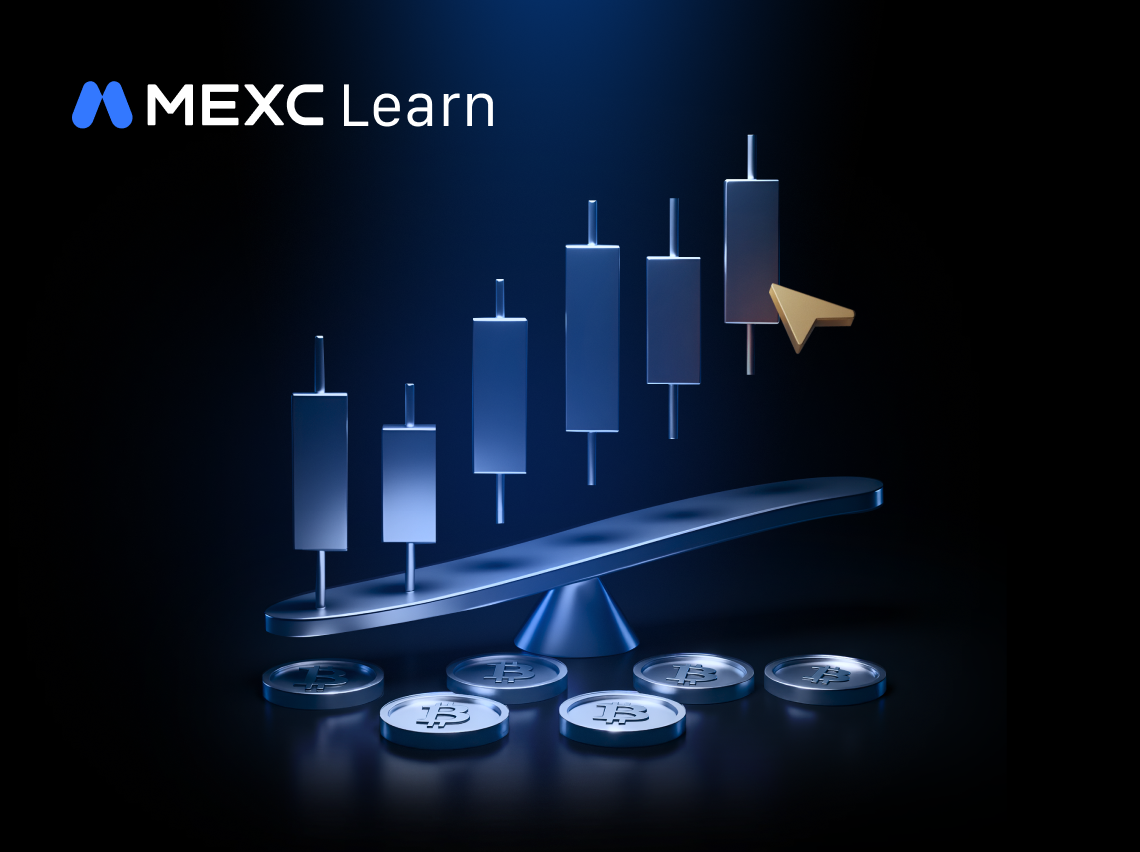
Crude Oil Futures Chart: How to Read the Energy Market
If you want to trade global energy, the crude oil futures chart is your most important tool. It is not just a picture of past prices. It is a live map of human psychology, supply, and demand.
Many beginners look at a trading chart and feel confused by the green and red bars. In this guide, I will explain exactly how to read a crude oil futures chart. I will also show you how to spot macro trends and execute trades using MEXC.
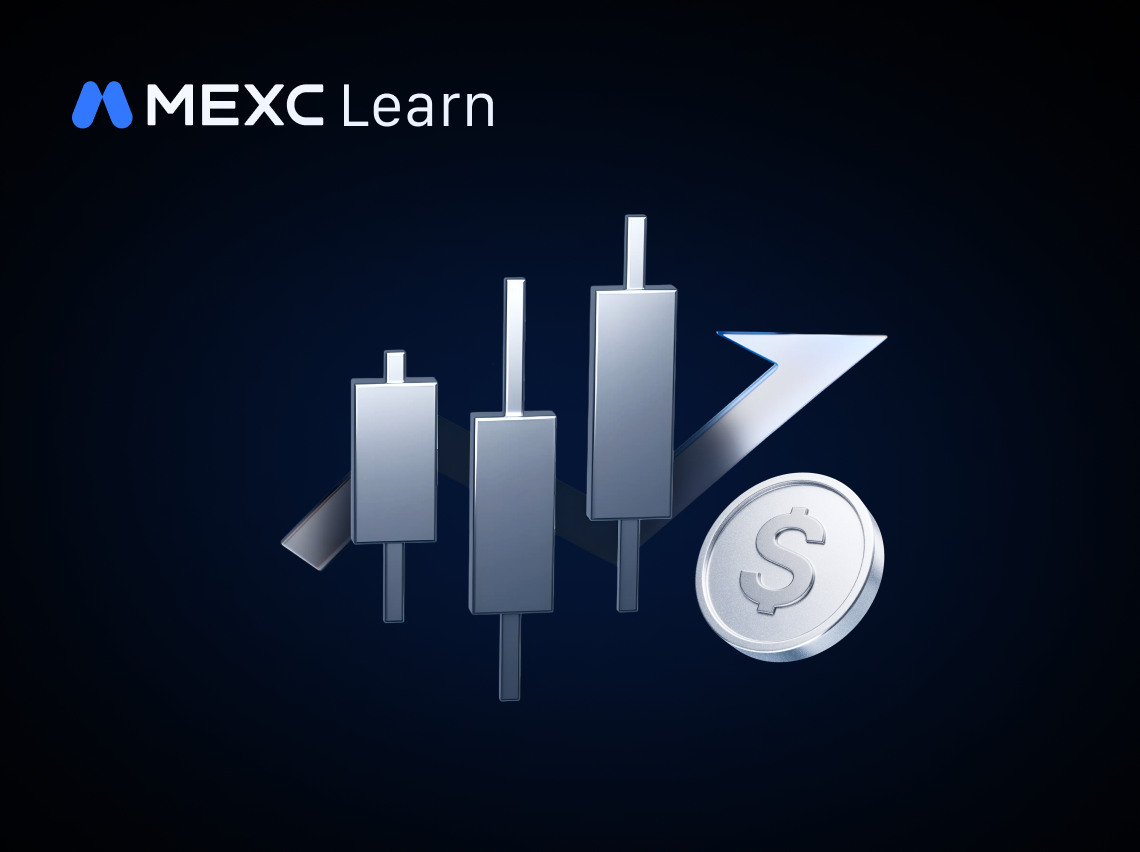
The Anatomy of a Candlestick
Most professional traders use a "candlestick" chart (or K-line chart) to track oil prices. Each candlestick shows you the price action for a specific time period, like one hour or one day.
Every single candlestick gives you four critical pieces of data, known as OHLC:
Open: The price when the time period started.
High: The highest price reached during that time.
Low: The lowest price dropped to during that time.
Close: The final price when the time period ended.
If the Close is higher than the Open, the candlestick is green (Bullish). Buyers won the battle. If the Close is lower than the Open, the candlestick is red (Bearish). Sellers pushed the price down.
WTI vs. Brent on the Chart
When you open an exchange, you will see different charts for different types of oil. You must choose the right chart for your strategy.
If you are trading US economic data, you should open the WTI chart. If you are trading Middle East news, you should open the Brent chart. To understand why these two charts move slightly differently during a crisis, read our guide on the difference between WTI and Brent.
Interactive Chart Reading Simulator
The best way to understand a crude oil futures chart is to interact with one. Use the educational simulator below to see how candlesticks form. You can trigger different macro events to see how the chart reacts in real time.
Hover over the candles to read the exact Open, High, Low, and Close data.
Why 24/7 Chart Access Matters
Traditional commodity markets close on Friday evening. They do not open again until Monday morning. This creates a massive problem.
If a war starts on Saturday, the oil price will gap up massively. Traditional traders cannot see this on their charts or protect their money until Monday. By then, it is too late.
This is why modern traders use synthetic derivatives. If you want to know how this works behind the scenes, read what are crypto crude oil futures. Because crypto exchanges never sleep, your WTI and Brent charts update 24 hours a day, 7 days a week. You can see the price action the exact second a news story breaks.
Execute Your Strategy on MEXC
Once you know how to read the chart, it is time to trade. If you are ready to learn how to trade crude oil with USDT, MEXC provides the ultimate platform.
Here is why you should trade oil on MEXC:
0% Trading Fees: Every time a candlestick closes, you can enter or exit a trade without paying high broker commissions.
200x Leverage: You can use a small amount of capital to catch big profits from minor chart breakouts.
Deep Liquidity: MEXC offers institutional-grade order books. This means your market orders execute instantly, exactly where you see the price on the chart.
Do not trade blindly. Learn the chart, manage your risk, and trade the global energy market with confidence. Log in to MEXC, open the USOIL or UKOIL chart, and start catching the next big macro trend today.
Artikel Populer
Lihat Selengkapnya
Pesaing Oura: Samsung, Apple, dan Pasar Smart Ring
Menurut prospektus IPO-nya, pesaing Oura terbagi dalam tiga kelompok: pembuat jam tangan pintar seperti Apple, Google, dan Samsung; perangkat wearable kebugaran seperti Garmin, Coros, dan Whoop; serta
Apakah Oura Menguntungkan? Pendapatan, Model Bisnis, dan Valuasi
Ya, Oura menguntungkan berdasarkan laba bersih. Prospektus IPO-nya menunjukkan laba bersih sebesar $60,8 juta dari pendapatan $1,21 miliar dalam sembilan bulan hingga 30 Juni 2026. Kerugian $924,3 jut

Review Bitget 2026: Skor 3,8 dari 5, Copy Trading Paling Lengkap, dan Tiga Tanggal Penting Keluarnya Bitget dari Jepang
Per 25 September 2026, Bitget meraih skor 3,8 dari 5 pada penilaian enam dimensi kami: unggul di derivatif, mendapat skor sementara 3,5 untuk keamanan setelah insiden hot wallet senilai sekitar US$351
Artikel Terkait
Lihat Selengkapnya
Perkiraan USDJPY Setelah Lonjakan Yen 30 Juli 2026: Mengapa Dolar Turun dan Apa Selanjutnya
USDJPY mengalami pembalikan yang sangat tajam dan tidak biasa pada malam 30 Juli 2026, waktu Hong Kong. Dolar AS turun hingga 3% terhadap yen Jepang, sempat mendorong USDJPY turun ke sekitar 158,34 se
Arus Aset Cerdas Kripto ke MEXC: Apa yang Diungkapkan Arus Masuk Bersih 24 Jam dan 7 Hari
RingkasanDi pasar mata uang kripto, modal sering bergerak menuju platform yang menawarkan likuiditas kompetitif, cakupan aset yang luas, infrastruktur perdagangan yang efisien, dan informasi cadangan
Saham AI, Pusat Data, dan Kripto: Mengapa Perdagangan AI Menjadi Siklus Pengeluaran Modal
AI tidak lagi sekadar tema perangkat lunak atau narasi token jangka pendek. Ini berkembang menjadi siklus pengeluaran modal (CapEx) lintas aset yang menghubungkan saham teknologi mega-cap AS, semikond