Bitcoin is showing signs that market stress has moved deep into territory typically associated with capitulation phases during a market cycle.
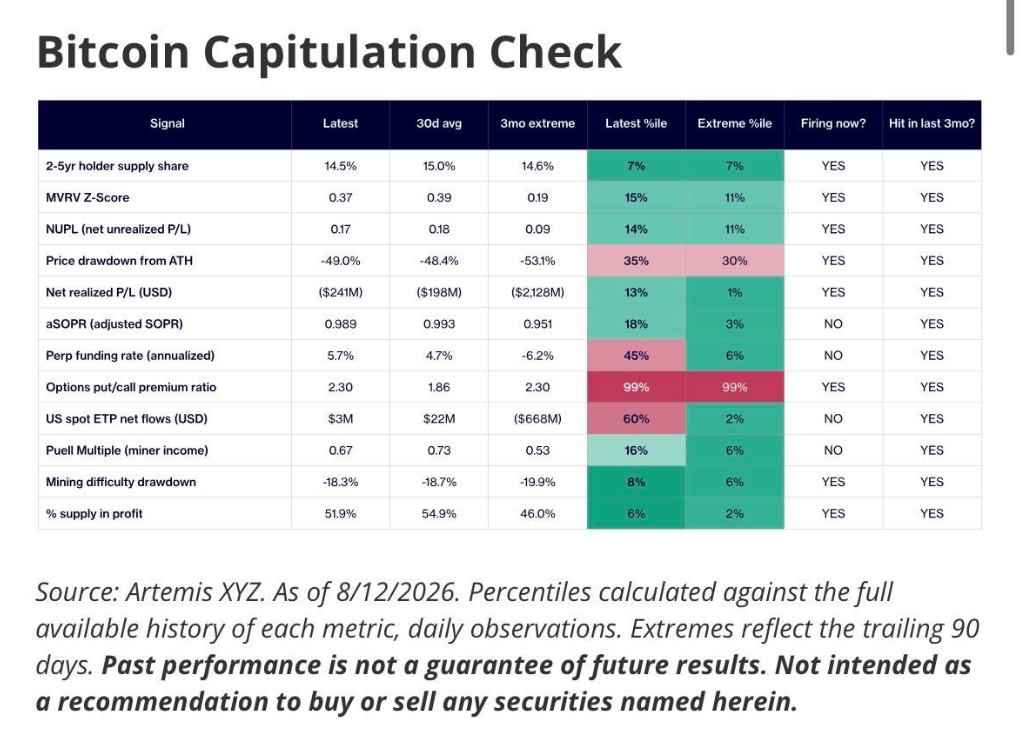
According to VanEck’s Mid-August 2026 Bitcoin ChainCheck report, as of August 12, 8 out of 12 Bitcoin capitulation indicators were active. More notably, all 12 indicators had entered capitulation territory at least once during the previous three months.
This comes as Bitcoin has fallen approximately 49% from its peak near $126,300 in October 2025. That decline remains significantly smaller than in previous bear markets, when BTC lost between 78% and 94% of its value. However, multiple on-chain and derivatives-market indicators suggest that investor stress has already become extremely severe.
VanEck argues that this cycle may not require a 70–90% decline to reach a level of capitulation similar to past cycles. The emergence of spot Bitcoin ETFs, greater institutional ownership, and the absence of a major chain of bankruptcies like Celsius, Three Arrows Capital, or FTX could result in a shallower cycle bottom.
However, this does not mean Bitcoin has already bottomed. The 8/12 capitulation signals reflect the degree of pain in the market, not a buy signal or confirmation of an absolute bottom.
Key Takeaways
VanEck recorded 8/12 Bitcoin capitulation indicators as active as of August 12, 2026.
All 12/12 indicators had entered capitulation territory at least once during the previous three months.
Bitcoin has fallen approximately 49% from its ATH, significantly less than the 78–94% declines seen in previous bear markets.
Around half of Bitcoin’s supply is near breakeven or in loss.
The options market shows extreme demand for downside protection.
VanEck believes ETFs and institutional participation could result in a shallower cycle bottom than in the past.
Capitulation does not mean Bitcoin has definitely reached a bottom.
What Is Bitcoin Capitulation?
In financial markets, capitulation usually describes a period when prolonged downward pressure causes a large number of investors to finally give up their positions.
This phase often involves several developments occurring at the same time:
Investors suffer significant losses.
Long-term holders begin selling.
Prices fall sharply from their highs.
Market sentiment turns extremely bearish.
Investors pay high premiums to protect against further downside.
A large portion of the supply moves into an unrealized loss.
Capitulation often appears near the later stages of a
bear market, but it does not mean prices immediately bottom after these signals appear.
The market can remain in a capitulation phase for weeks or even months before a new uptrend begins.
This is exactly why VanEck uses 12 different indicators instead of looking only at how much Bitcoin has fallen.
Why Does VanEck Use 12 Signals Instead of Looking Only at Price?
If drawdown alone is used, the current market still does not resemble a traditional Bitcoin bear market.
Previous cycles show:
2011 bear market: Bitcoin fell approximately 94%.
2013–2015 cycle: approximately 85%.
2017–2018 cycle: approximately 84%.
2021–2022 cycle: approximately 78%.
Meanwhile, Bitcoin is currently down only around 49% from its ATH.
If history were applied mechanically, one might conclude that BTC still has significant room to fall.
But VanEck argues that this view may ignore the fact that Bitcoin’s market structure has changed.
For that reason, the firm evaluates multiple categories of data at the same time, including:
Drawdown.
MVRV Z-Score.
Net Unrealized Profit/Loss.
Puell Multiple.
Supply in Profit.
Long-term holder activity.
Derivatives and options data.
When multiple independent indicators simultaneously move into extreme territory, they may reflect investor stress more accurately than price alone.
What Does It Mean That 8/12 Capitulation Signals Are Active?
At the time VanEck finalized its data on August 12:
8/12 capitulation indicators were active.
But an even more notable fact is:
All 12 indicators had been triggered at least once during the previous three months.
This suggests that capitulation has not been limited to one small part of the market.
It has spread across multiple categories of data.
Put simply:
Price has not fallen as deeply as it did in 2018 or 2022, but the stress beneath the surface has already progressed significantly.
This is why Bitcoin may currently be experiencing a bear market with a shallower drawdown but still a high level of pain.
Nearly Half of Bitcoin’s Supply Is No Longer in Profit
One important signal is Supply in Profit.
This metric measures the percentage of Bitcoin supply whose average acquisition price is below the current market price.
When Bitcoin rises strongly, most of the supply is usually in profit.
But when prices fall sharply, that percentage begins to decline.
Mid-August data showed that the market had reached a point where roughly half of all Bitcoin was around breakeven or in an unrealized loss.
This is psychologically important.
As the number of underwater holders increases:
Price falls → unrealized losses increase → confidence weakens → selling pressure rises.
This is one of the mechanisms commonly seen near market capitulation.
Long-Term Holders Are Also Coming Under Pressure
Long-term holders are usually less sensitive to short-term price fluctuations.
However, VanEck recorded approximately 356,000 BTC sold by long-term holders over a 30-day period at the time of the report.
This is notable because when even high-conviction investors begin distributing assets, the market may be entering a deeper stress phase.
In previous bear markets, capitulation by long-term holders was often one of the necessary signals for Bitcoin to move from buyers with high cost bases to investors with lower cost bases.
That process can help build the foundation for a new accumulation phase.
The Options Market Is Extremely Defensive
Perhaps the clearest signal of current market sentiment comes from the options market.
During the 30 days through August 11, VanEck recorded:
Total options premium: approximately $789.3 million.
Put premium: $551.8 million, up 42%.
Call premium: $237.6 million, down 10%.
Put/Call premium ratio: 2.30.
For comparison, the average level of the final metric is only around 0.71.
A ratio of 2.30 sits in the 99th percentile since 2021.
This shows that investors are willing to pay very high premiums to protect their portfolios against further Bitcoin declines.
It can be summarized as:
Put demand rises sharply → demand for protection increases → the market becomes highly defensive.
In many cases, extremely defensive sentiment appears when much of the perceived risk has already been recognized by the market.
But it still does not indicate exactly when price will reverse.
Why Might BTC Not Need to Fall 80% Like Before?
This is one of VanEck’s most notable arguments.
Bitcoin’s market structure in 2026 is significantly different from previous bear markets.
Spot Bitcoin ETFs Now Exist
Traditional investors can now buy Bitcoin through products traded on stock exchanges.
This creates a new source of demand that did not exist in earlier cycles.
Institutional Ownership Is Higher
Bitcoin is now held by:
Asset managers.
Public companies.
Family offices.
Financial institutions.
These buyers have different capital structures and investment horizons from retail traders.
The Market Has Less 2022-Style Leverage
The 2022 bear market was not simply a price decline.
It was a chain reaction:
Terra/LUNA → Three Arrows Capital → Celsius/Voyager → FTX/Alameda → BlockFi/Genesis.
Each bankruptcy created additional forced selling and liquidations.
VanEck argues that the market has not yet seen a comparable event in the current cycle.
That means Bitcoin could still experience capitulation without falling 80% from its peak.
Spot ETFs Could Change the Shape of a Bear Market
In the past, when the crypto market fell sharply, new buyers typically had to:
Open an account with a crypto exchange.
Transfer funds.
Self-custody assets or accept exchange risk.
Interact directly with crypto infrastructure.
ETFs have changed that process.
An asset manager can now buy Bitcoin through the same system used to trade
stocks, bonds, or gold.
This creates the possibility that buying demand emerges at smaller drawdowns than in previous cycles.
If Bitcoin falls 40–50% and institutions view those levels as attractive, ETF inflows could begin absorbing supply before the market reaches an 80% decline.
This is one reason why directly comparing:
2026 = 2022 = 2018
may no longer be appropriate.
But 8/12 Signals Do Not Mean the Bottom Is In
This is the most important point in the entire report.
A capitulation indicator is not a bottom indicator.
VanEck examined historical data and found that when 8–12 capitulation signals appeared simultaneously, Bitcoin’s subsequent performance did not immediately outperform.
Over approximately 90 days:
Average return after capitulation: 12.8%.
Average return across all periods: 15.2%.
Over 180 days:
After capitulation: 32.0%.
Overall average: 36.3%.
This means that during the first 3–6 months, capitulation signals did not provide a clear forecasting advantage.
Bitcoin could therefore still:
Fall further.
Trade sideways for months.
Retest the lows.
Experience additional waves of capitulation.
before a new bull market begins.
What Is the Difference Between Capitulation and Accumulation?
The two phases often occur near each other, but they are not the same.
Capitulation
Existing investors give up their positions.
Characteristics include:
High selling pressure.
Large unrealized losses.
Extreme fear.
Weak holders selling assets.
Accumulation
Supply begins moving toward buyers with stronger long-term conviction.
Characteristics include:
Price may trade sideways.
Volatility gradually decreases.
Selling pressure weakens.
Long-term holders begin increasing positions.
VanEck believes current data is consistent with the possibility that Bitcoin has already experienced capitulation and is approaching or entering an accumulation phase.
But accumulation can last a very long time.
That is why “near the bottom” and “about to rally strongly” are two very different concepts.
The Current Bear Market Could Be a New Type of Cycle
If VanEck’s thesis is correct, the current cycle may indicate a structural change in Bitcoin.
Previous bear markets often followed this pattern:
Bull market → extreme leverage → bankruptcies → forced liquidations → -80%.
A new cycle could look more like:
Bull market → institutional positioning → deleveraging → prolonged stress → -40% to -60% → accumulation.
This would make drawdowns shallower while still allowing the period of market stress to remain prolonged.
In other words:
A bear market does not need to fall 80% to be painful enough.
If millions of investors bought Bitcoin at high prices, a 50% decline lasting several months could still create substantial capitulation.
What Could Confirm a Bottom More Reliably?
VanEck’s 8/12 signals are notable, but evaluating a sustainable bottom still requires additional confirmation.
Some factors worth monitoring include:
Supply in Profit begins recovering.
Long-term holder selling declines.
MVRV exits extreme territory.
Put/Call ratio cools.
BTC regains long-term moving averages.
ETF flows shift into a sustained positive trend.
Liquidity and the macro environment improve.
If several of these factors appear at the same time, the accumulation thesis would become stronger.
Impact on Bitcoin Investors
VanEck’s report offers a more balanced interpretation between two extremes.
One side might argue:
“Bitcoin is only down 49%, while previous bear markets fell 80%, so BTC must fall further.”
But this ignores changes in market structure.
The other side might argue:
“8/12 capitulation signals are active, so the bottom must already be in.”
Historical data does not support that conclusion either.
A more appropriate interpretation is:
Bitcoin has fallen far enough for many historical indicators to identify a capitulation environment, but there is still no definitive evidence that the bottoming process is complete.
Conclusion
VanEck’s latest report suggests that the current Bitcoin bear market may be entering an important phase.
Although BTC is down only around 49% from its ATH, significantly less than the 78–94% declines seen in previous cycles, 8/12 capitulation indicators are currently active, and all 12 indicators entered capitulation territory at least once during the past three months.
Data on Supply in Profit, long-term holder activity, and demand for put options all suggest that market stress has already become extremely severe.
The most notable part of VanEck’s thesis is that Bitcoin may not need to repeat an 80% decline like in the past. Spot ETFs, institutional capital, and the absence of a 2022-style chain of leveraged bankruptcies could mean that a smaller drawdown is enough to produce capitulation.
However, capitulation is not confirmation of a bottom.
VanEck’s own historical data shows that these signals do not provide a clear forecasting advantage over the first 3–6 months. Bitcoin could therefore remain volatile, retest lower levels, or spend an extended period in accumulation.
What the report shows more clearly is that market pain is already extremely high, even though the percentage decline has not reached the extreme levels seen in previous bear markets.
If Bitcoin’s market structure has truly changed because of ETFs and institutional adoption, the 2026 cycle could become the first example of a bear market where capitulation is deep in sentiment and on-chain data, but significantly shallower in price.
FAQ
How Many Capitulation Signals Is VanEck Currently Recording?
As of August 12, 2026, 8 of the 12 indicators were active. All 12 had entered capitulation territory at least once during the previous three months.
How Far Has Bitcoin Fallen From Its Peak?
BTC has fallen approximately 49% from its ATH of around $126,300 set in October 2025.
Does 8/12 Signals Mean Bitcoin Has Bottomed?
No. VanEck emphasizes that capitulation indicators reflect the degree of market stress, not confirmation of a bottom.
Why Might Bitcoin Not Fall 80% Like in Previous Cycles?
VanEck believes spot Bitcoin ETFs, greater institutional ownership, and the absence of a leveraged bankruptcy chain like Celsius, 3AC, and FTX could result in a shallower bottom.
What Is the Options Market Showing?
The Put/Call premium ratio rose to approximately 2.30, an extreme historical level, showing that investors are paying high premiums to protect against further downside.
Is Bitcoin Already in an Accumulation Phase?
VanEck believes the market may be approaching or entering accumulation, but it is still impossible to say with certainty that the bottoming process is complete.
Disclaimer: The information provided here is for informational purposes only and should not be considered financial, investment, legal, or professional advice. Always conduct your own research, consider your financial situation, and, if necessary, consult with a licensed professional before making any decisions.