NVIDIA (NVDA stock) and Advanced Micro Devices (AMD stock) sit at the center of the modern computing stack—CPUs, GPUs, networking, and accelerators that power PCs, cloud data centers, gaming, and now NVIDIA (NVDA stock) and Advanced Micro Devices (AMD stock) sit at the center of the modern computing stack—CPUs, GPUs, networking, and accelerators that power PCs, cloud data centers, gaming, and now

NVDA vs AMD: The Nasdaq AI Chip Race, Returns, and Business Models

NVIDIA (NVDA stock) and Advanced Micro Devices (AMD stock) sit at the center of the modern computing stack—CPUs, GPUs, networking, and accelerators that power PCs, cloud data centers, gaming, and now the AI buildout. Both trade on the Nasdaq and are widely owned by institutions, index funds, and retail investors.
But “both are chip stocks” is where the similarity ends. NVDA has evolved into a full-stack AI infrastructure supplier with a software moat (CUDA) and tight platform control, while AMD is a broad-based compute challenger spanning CPUs, GPUs, and adaptive/embedded silicon—often winning by performance-per-dollar and portfolio breadth. These differences show up clearly in price history, dividends, and long-run return patterns.

What NVDA and AMD actually sell: product stack and business model

NVIDIA: GPUs + networking + software platforms

NVIDIA’s business model is increasingly platform-driven. While it still sells GPUs, it also sells the surrounding ecosystem that makes those GPUs easy to deploy at scale: high-performance networking, systems, and an extensive software stack used by developers and enterprises. In the AI era, that “whole platform” position matters because customers don’t just buy chips—they buy time-to-train, reliability, and an end-to-end solution.
A simple way to see NVIDIA’s center of gravity is segment revenue. In fiscal 2025, Investopedia reports data center revenue of $115.2B and gaming revenue of $11.4B, with professional visualization at $1.9B—showing how dominant the data center engine has become. NVIDIA’s own FY2025 results release also underscores how fast that flywheel was accelerating during the AI capex cycle.
Product reality in plain terms: NVIDIA sells the “picks and shovels” for AI (accelerators), and increasingly sells the “mine” (the integrated systems + networking + software that make those accelerators productive).

AMD: CPUs + GPUs + adaptive computing

AMD competes across more categories. Its four reported segments are Data Center, Client, Gaming, and Embedded. In FY2024, AMD’s segment net revenue was roughly $12.636B (Data Center), $7.081B (Client), $2.562B (Gaming), and $3.502B (Embedded).
AMD’s portfolio spans:
  • Data Center: EPYC server CPUs and Instinct accelerators (plus supporting products)
  • Client: Ryzen PC CPUs/APUs
  • Gaming: console SoCs and Radeon graphics
  • Embedded/Adaptive: FPGA and embedded silicon (post-Xilinx era)
AMD has also disclosed that it plans to combine Client and Gaming into one reportable segment beginning with its fiscal year ending December 27, 2025, reflecting how management runs the business.
Product reality in plain terms: AMD is a “compute catalog” that can win sockets across CPU and GPU, and it often competes by offering a strong alternative where customers want a second source, better cost efficiency, or a broader mix of compute options.

Common ground: why NVDA and AMD often move together

Even with very different models, NVDA stock and AMD stock share several structural drivers:
  1. They’re cyclical. Semiconductor demand is tied to data center spending, PC refresh cycles, and consumer electronics cycles.
  2. They’re capex-sensitive. Big buyers (hyperscalers and enterprises) can shift budgets quickly, especially in AI infrastructure cycles.
  3. They’re “risk-on Nasdaq” exposures. When rates, liquidity, or tech sentiment swings, both can re-rate sharply.
  4. They compete in overlapping arenas. Data center acceleration and AI inference/training are strategic battlegrounds for both.
In practice, a macro shock can hit both names, but the magnitude and recovery path often differ because NVIDIA’s margins and platform pricing power have tended to be more “winner-take-most” in AI accelerators, while AMD’s story often hinges on share gains, roadmap execution, and mix improvements.

Price history: year-end closes show different eras of dominance

The table below uses Stooq daily close data and takes the last trading day close of each year (split-adjusted series on Stooq).
Year
NVDA (year-end close, adj.)
AMD (year-end close, adj.)
2016
2.63
11.34
2017
4.79
10.28
2018
3.31
18.46
2019
5.86
45.86
2020
13.02
91.71
2021
29.36
143.9
2022
14.6
64.77
2023
49.51
147.41
2024
134.29
120.79
2025
186.5
214.16
How to read this:
  • NVDA’s “step-change” shows up most dramatically from 2023–2025, reflecting how the market priced NVIDIA as the prime beneficiary of AI infrastructure demand.
  • AMD’s path shows powerful rallies (notably 2016, 2019–2021, 2023, 2025) but also sharper periods of digestion when the market reset expectations on PC demand, gaming, or competitive dynamics.
Over 2016–2025, these year-end closes imply NVDA rose by about 71× and AMD by about 19× on this adjusted series (directionally consistent with the widely discussed gap in compounded outcomes).

Dividends: NVDA pays (small); AMD does not

For investors who care about dividend policy, NVDA and AMD are not symmetrical.
NVIDIA dividends: Fidelity’s history shows annual dividend per share rising from $0.0121 (2016) to $0.0400 (2025).
AMD dividends: AMD has generally emphasized reinvestment and has no regular dividend; data sources commonly list AMD’s dividend as $0.00.
Year
NVDA dividend/share (USD)
AMD dividend/share (USD)
2016
0.0121
0
2017
0.0143
0
2018
0.0153
0
2019
0.016
0
2020
0.016
0
2021
0.016
0
2022
0.016
0
2023
0.016
0
2024
0.034
0
2025
0.04
0
Investor takeaway: Neither stock is a classic “dividend stock.” NVDA’s dividend exists but is tiny relative to the scale of its price moves and total return; AMD’s shareholder-return story is typically expressed through growth, mix, and valuation re-rating rather than cash payouts.

Total returns: the decade where compounding separated the two

Annual returns can look chaotic year-to-year, but they reveal regime shifts: product cycles, competitive wins, and macro resets. The table below uses TotalRealReturns annual returns (total return framework; dividends are trivial for these names but are included in the methodology).
Year
NVDA total return
AMD total return
2016
+226.95%
+295.12%
2017
+81.99%
−9.35%
2018
−30.82%
+79.57%
2019
+76.94%
+148.43%
2020
+122.3%
+99.98%
2021
+125.48%
+56.91%
2022
−50.26%
−54.99%
2023
+239.02%
+127.59%
2024
+171.25%
−18.06%
2025
+38.92%
+77.3%
What this suggests (without overfitting one era):
  • Both names can deliver “venture-style” equity outcomes in strong cycles (2016, 2019–2021, 2023).
  • NVDA’s 2023–2024 performance was extraordinary, reflecting the market’s view of NVIDIA’s AI platform dominance.
  • AMD can still outperform in specific years (e.g., 2016 and 2025 here), but it has historically required the market to believe in sustained share gains plus a favorable demand cycle.

Why the market pays different multiples: the “moat shape” matters

NVIDIA’s moat: software lock-in + system-level pricing power

NVIDIA is not just selling silicon; it sells an ecosystem. CUDA and NVIDIA’s software tooling reduce switching friction for developers and enterprises, which can translate into pricing power when demand is high. When customers treat NVIDIA hardware/software as the default standard for training and deploying AI models, NVDA stock can trade more like a “platform company” than a pure semiconductor manufacturer.

AMD’s moat: credible second source + broad compute portfolio

AMD’s edge is credibility across CPU and GPU and the ability to offer “good enough to best-in-class” performance at competitive pricing. In large deployments, buyers often want vendor diversity, supply resilience, and leverage in negotiations—AMD benefits when that preference expands. AMD’s portfolio breadth (server CPUs + accelerators + embedded/adaptive) also helps diversify revenue, though the mix is still heavily shaped by data center demand.

Risk checklist: what can break the thesis for each

Shared risks (both NVDA stock and AMD stock):
  • AI capex normalization: If hyperscaler spending slows, both can re-rate lower.
  • Export controls / geopolitics: Restrictions can hit volumes and mix.
  • Inventory cycles: Semis routinely overshoot and correct.
  • Competition: From each other, plus Intel and custom silicon from cloud providers.
More NVDA-specific:
  • Concentration risk in AI accelerators: if an alternative stack gains meaningful traction, NVDA’s platform premium could compress.
More AMD-specific:
  • Execution risk in accelerators: AMD must prove sustained competitiveness and scale in AI accelerators to narrow the perception gap vs NVIDIA’s ecosystem.

How this comparison is used in real work

In asset management, research, and even corporate strategy, “NVDA vs AMD” comparisons often show up in three practical workflows:
  1. Earnings prep: build a simple scorecard (data center growth, gross margin, product roadmap, customer concentration).
  2. Scenario analysis: estimate what happens if AI infrastructure spend slows, or if AMD gains a defined share of accelerator deployments.
  3. Portfolio construction: decide whether you want a single “category winner” exposure (more NVDA-like) or a diversified challenger exposure (more AMD-like), then size positions based on volatility and drawdown tolerance.

Tokenized U.S. stocks on MEXC: NVDAON and AMDON (and how they differ from shares)

Some platforms now offer tokenized stock products that aim to provide price exposure to U.S. equities through on-chain tokens. MEXC lists tokenized versions such as NVDAON/USDT and AMDON/USDT. Tokenization is often described as putting stock-like economic exposure into a blockchain format (commonly designed to track the underlying price, depending on structure).
Key differences vs owning NVDA or AMD shares directly:
  • Shareholder rights: Tokenized products may not provide voting rights and may not mirror dividend entitlement the way direct share ownership does (design varies).
  • Trading hours/rails: Tokenized products may trade with crypto-style market structure, potentially offering different access windows than the Nasdaq cash equity market.
  • Product risk stack: Beyond price risk, you may have additional risks tied to token structure, custody/issuer design, and platform-specific rules.
If your goal is direct equity ownership (full shareholder rights, standard brokerage protections, and conventional market structure), buying the listed Nasdaq shares is the clean reference. If your goal is on-chain price exposure inside a crypto venue, tokenized products like NVDAON and AMDON are structurally different instruments that may fit a different use case.

Bottom line: the same “AI wave,” but different ways to win

  • NVDA stock has been priced as the primary “AI infrastructure platform,” reinforced by data center dominance and an ecosystem moat that can translate to platform-style economics.
  • AMD stock is the multi-category challenger with a wide compute portfolio and clear upside when it executes, gains share, and rides favorable demand cycles—especially as customers diversify suppliers.
For investors, the practical choice is often less about “which company is good” and more about which return engine you want: NVIDIA’s platform premium and potential margin durability versus AMD’s share-gain leverage and portfolio breadth—both under the umbrella of Nasdaq tech cyclicality.
 
Disclaimer: This article is for educational purposes and general research. It is not financial advice or a recommendation to buy or sell any security or digital asset.
Peluang Pasar
Logo Gensyn
Harga Gensyn(AI)
--
----
USD
Grafik Harga Live Gensyn (AI)

Artikel-artikel yang dibagikan di halaman ini bersumber dari platform publik dan disediakan hanya sebagai referensi. Artikel tersebut tidak mewakili posisi atau pandangan MEXC. Seluruh hak merupakan milik MEXC. Jika Anda meyakini ada konten yang melanggar hak pihak ketiga, silakan hubungi [email protected] untuk penghapusan segera. MEXC tidak menjamin keakuratan, kelengkapan, atau keaktualan konten apa pun dan tidak bertanggung jawab terhadap segala tindakan yang dilakukan berdasarkan informasi yang diberikan. Konten tersebut bukan merupakan saran keuangan, hukum, atau profesional lainnya, serta tidak boleh ditafsirkan sebagai rekomendasi atau dukungan oleh MEXC. Untuk mendapatkan wawasan ahli dan analisis mendalam, kunjungi MEXC Learn.

Info Gensyn Terkini

Lihat Selengkapnya
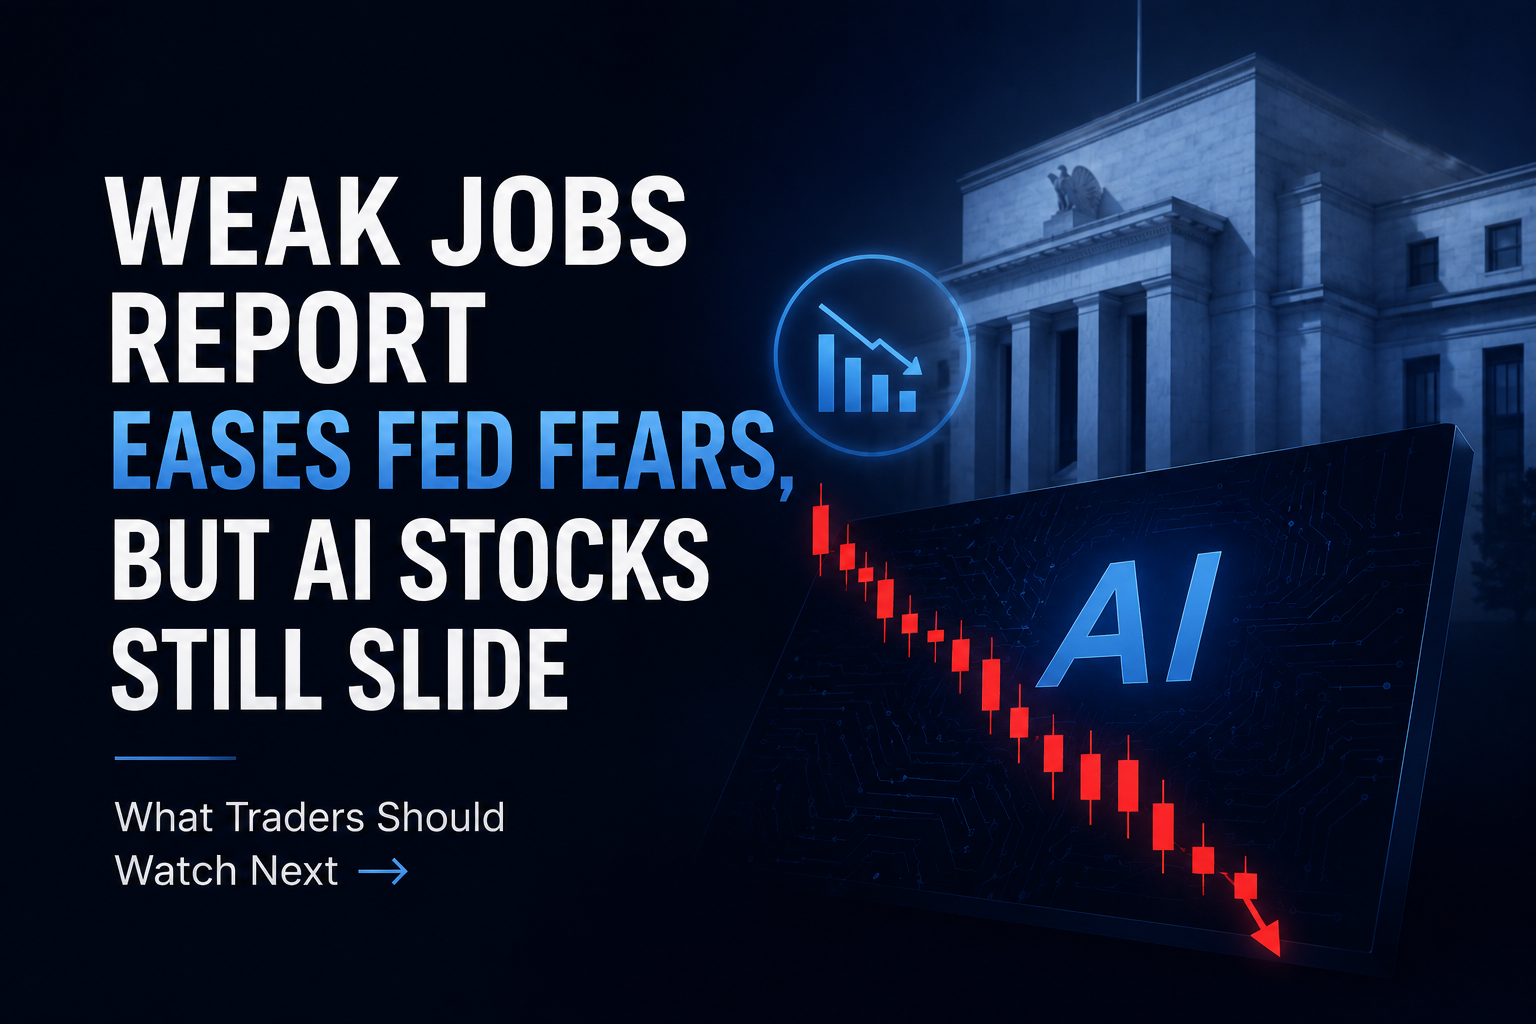
Laporan Pekerjaan yang Lemah Meredakan Kekhawatiran Fed, Tetapi Saham AI Tetap Turun: Apa yang Harus Diperhatikan Trader Selanjutnya

Laporan Pekerjaan yang Lemah Meredakan Kekhawatiran Fed, Tetapi Saham AI Tetap Turun: Apa yang Harus Diperhatikan Trader Selanjutnya

Laporan pekerjaan AS bulan Juni mengisyaratkan perlambatan ekonomi yang jelas, meleset dari ekspektasi dan menurunkan kekhawatiran kenaikan suku bunga Federal Reserve. Meskipun imbal hasil Treasury lebih rendah, saham AI dan teknologi merosot, membuktikan bahwa pelonggaran suku bunga makro tidak lagi menjadi katalisator yang dijamin untuk teknologi dengan valuasi tinggi. Bitcoin dan emas berada pada posisi untuk mendapatkan keuntungan dari dolar AS yang lebih lemah, tetapi memerlukan konfirmasi untuk mempertahankan reli. Trader harus mengalihkan fokus mereka dari kebijakan Fed ke kualitas pendapatan Kuartal 2 untuk membenarkan premi pasar saat ini.
2026/07/03
Tanggal Laporan Keuangan Tesla Q2 2026: Waktu Rilis, Webcast, dan Metrik Utama
Tanggal Laporan Keuangan Tesla Q2 2026: Waktu Rilis, Webcast, dan Metrik Utama

Laporan pendapatan Tesla Q2 2026 dijadwalkan pada hari Rabu, 22 Juli 2026, setelah penutupan pasar, dengan manajemen yang dijadwalkan menjadi tuan rumah webcast Tanya Jawab langsung pada pukul 16:30 Waktu Tengah (CT) / 17:30 Waktu Timur (ET). Pembaruan dan webcast Q2 akan tersedia melalui situs web Hubungan Investor Tesla, dengan tayangan ulang yang diarsipkan diharapkan setelah panggilan tersebut. Ini bukan sekadar tanggal laporan keuangan Tesla biasa. Tesla telah melaporkan kuartal pengiriman yang lebih kuat dari perkiraan: pada Q2 2026, perusahaan memproduksi 451.758 kendaraan, mengirimkan 480.126 kendaraan, dan menggunakan 13,5 GWh produk penyimpanan energi. Bagi para trader, pertanyaan kuncinya bukanlah apakah Tesla mengirimkan lebih banyak kendaraan. Bagian itu sudah diketahui. Pertanyaan sebenarnya adalah apakah pengiriman tersebut cukup menguntungkan, apakah pertumbuhan penyimpanan energi dapat mendukung kisah Tesla yang lebih luas, dan apakah manajemen dapat menunjukkan bahwa investasi AI, otonomi, dan robotaxi bergerak dari sekadar narasi menjadi kemajuan bisnis yang terukur.
2026/07/06
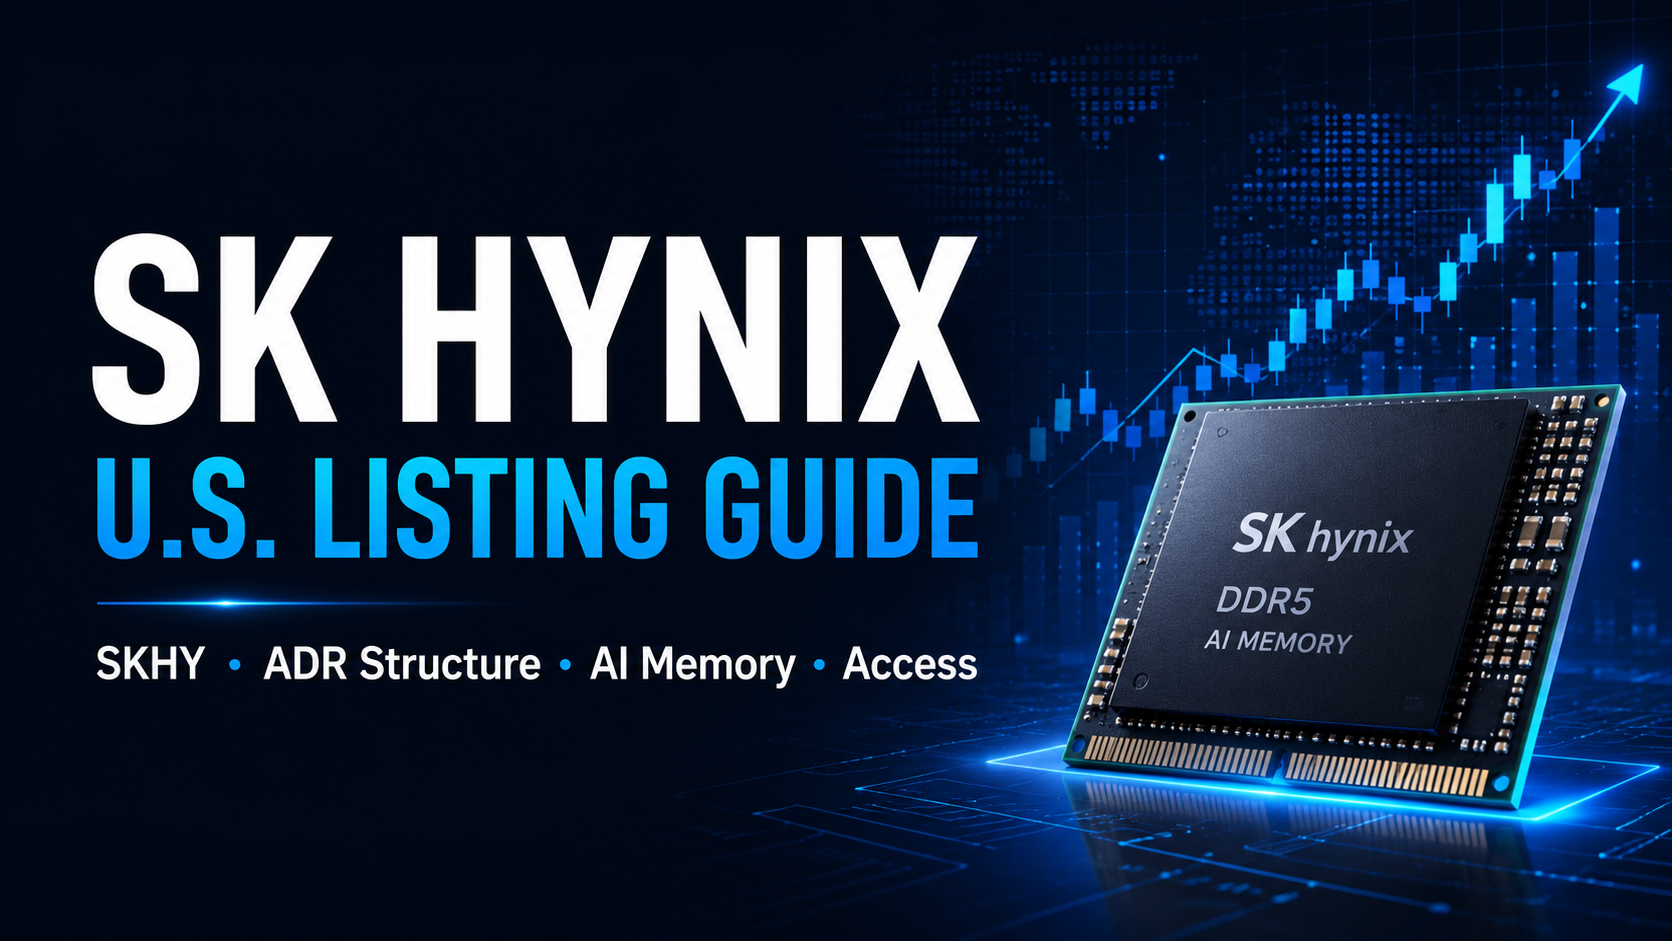
Panduan Pencatatan Saham SK Hynix di AS: Tanggal SKHY, Struktur ADR, Eksposur Memori AI, dan Akses MEXC


Panduan Pencatatan Saham SK Hynix di AS: Tanggal SKHY, Struktur ADR, Eksposur Memori AI, dan Akses MEXC

SK Hynix selangkah lebih dekat dengan debutnya di pasar AS, memberikan investor global cara baru untuk mengakses salah satu perusahaan paling penting dalam rantai pasokan memori AI. Produsen semikonduktor Korea Selatan ini telah meluncurkan penjualan saham AS dalam skala besar melalui American Depositary Receipts (ADR) di Nasdaq dengan perkiraan ticker SKHY. Menurut Reuters, SK Hynix berupaya mengumpulkan sekitar 43 triliun won, atau sekitar $28,07 miliar, melalui penawaran ADR ini. Perusahaan berencana untuk menerbitkan 17,79 juta saham baru, dengan 10 ADR mewakili satu saham biasa. Penetapan harga akhir diperkirakan pada 9 Juli, menjelang antisipasi debut perdagangan Nasdaq pada 10 Juli. Pencatatan ini penting karena SK Hynix bukan sekadar perusahaan asing lain yang mencari akses pasar AS. Ini adalah salah satu pemasok memori bandwidth tinggi (HBM) terkemuka di dunia—komponen penting yang menggerakkan akselerator AI dan infrastruktur pusat data modern. Pencatatan saham di AS bertujuan untuk memperluas basis investor SK Hynix, meningkatkan akses perdagangan bagi institusi AS, dan menguji apakah pasar bersedia menetapkan premi likuiditas yang lebih tinggi kepada pemimpin memori AI tersebut. Pada saat yang sama, investor tidak boleh memperlakukan pencatatan ini sebagai acara akses AI yang bebas risiko. Penawaran ini melibatkan saham yang baru diterbitkan, tiba setelah reli saham memori yang didorong AI besar-besaran, dan datang pada titik ketika pasar semakin sangat fokus pada belanja modal (capex), ekspansi kapasitas, dan risiko pembalikan siklus memori di masa depan.
2026/07/08
Lihat Selengkapnya