Introduction
Strategy Inc, the company long known as MicroStrategy and still trading under the ticker MSTR, has become the largest corporate holder of Bitcoin in the world. Rather than behaving like a typical software company, MSTR stock now trades almost like a leveraged proxy for Bitcoin itself, since the bulk of its balance sheet sits in BTC. This MSTR stock technical analysis looks at what the chart, moving averages, oscillators, and analyst targets are currently signaling after a brutal year for the stock.
MSTR stock has been on an extreme ride even by crypto adjacent standards. Shares are down 60.08 percent over the past year, falling from highs above $300 to a low near $100, driven largely by Bitcoin's own price swings and questions about the sustainability of the company's debt funded Bitcoin buying strategy. At the same time, the stock has surged 34.47 percent over just the past month, hinting at a possible recovery attempt. Whether you are searching for an MSTR stock forecast, wondering if MSTR stock is a buy after this crash, or looking for the current MSTR stock price prediction from Wall Street, this guide breaks it down in plain language.
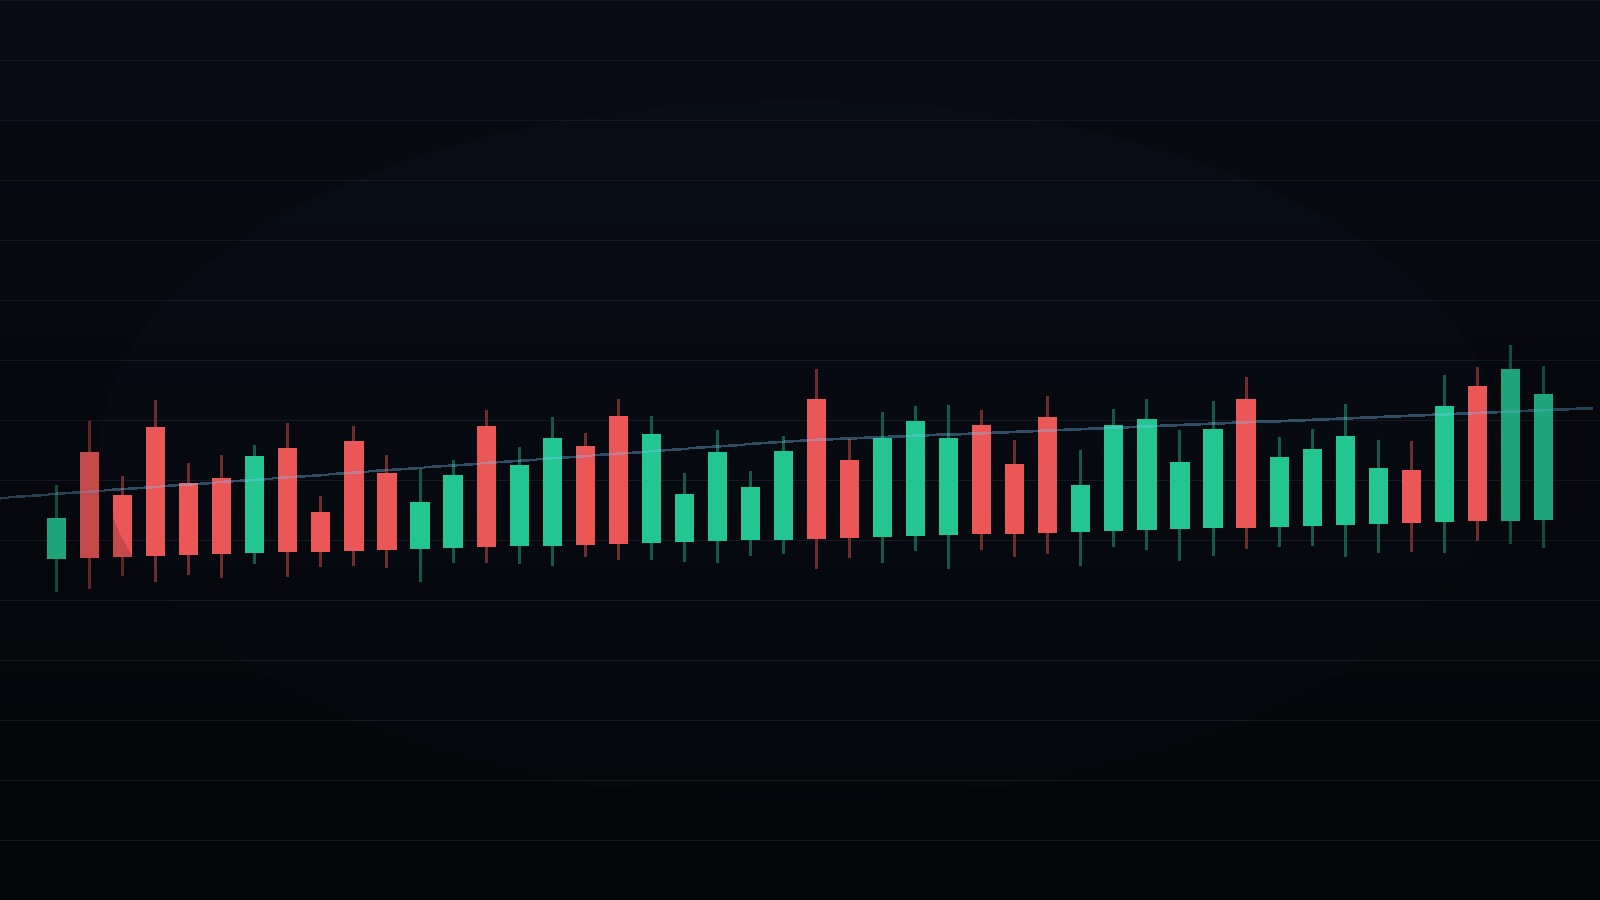
Strategy Inc, formerly MicroStrategy (NASDAQ: MSTR), technical analysis and price outlook
Key Highlights
MSTR closed at $130.97, up 1.87 percent on the day and up a strong 34.47 percent over the past month.
Despite the recent bounce, the stock remains down 60.08 percent over the past year, reflecting a brutal drawdown tied closely to Bitcoin's own price action.
Wall Street's average price target sits at $232.17, which is about 77 percent above the current price, based on 18 analysts.
Analyst sentiment is overwhelmingly bullish, with 17 of 21 analysts rating the stock strong buy and zero sell or strong sell ratings.
Short and medium term moving averages have turned bullish, though the 200 day averages still reflect the prior downtrend.
Oscillators are mostly neutral, suggesting the recent rally has room to continue without being stretched.
MSTR carries a high beta of 2.77 and does not report meaningful traditional earnings, since its financial results are dominated by Bitcoin holding gains and losses.
MSTR Stock Price Action: Reading the Recent Chart
Understanding MSTR stock technical analysis starts with recognizing just how tightly this stock is tied to Bitcoin's price. Over the past year, MSTR fell from highs above $300 down to roughly $100 at its lowest point, a decline of more than 60 percent, largely tracking Bitcoin's own retreat from its highs along with growing market scrutiny of the company's leveraged Bitcoin accumulation strategy.
The past month has told a very different story. MSTR has climbed 34.47 percent, moving from around $97 up through the $120s and into the $130s, with the stock closing the latest session at $130.97, up 1.87 percent. Volume on the latest session came in at 19.47 million shares, actually below the 30 day average of 24.32 million, which suggests the recent bounce has occurred on relatively orderly buying rather than a single dramatic spike. The chart below shows this sharp reversal off the monthly lows.
MSTR one month candlestick chart via TradingView, showing the sharp rebound off recent lows
It is worth stressing that this kind of move, a 60 percent yearly decline followed by a 34 percent monthly surge, is not typical of a stable large cap. MSTR behaves more like a high beta derivative of Bitcoin than a traditional equity, and traders should expect the stock to keep amplifying whatever direction Bitcoin itself moves in the months ahead.
Key Support and Resistance Levels for MSTR
Pivot point analysis offers a useful map of where MSTR could find support or hit resistance from here. The classic pivot sits near $121.22, with resistance levels at roughly $151.50, $170.07, and $218.92, and support levels near $102.65, $72.37, and $23.52 in a severe downside scenario.
Fibonacci pivots suggest a tighter resistance band around $139.88 and $151.41, while Camarilla pivots point to a narrower near term range between about $119.51 on the downside and $146.37 on the upside. With the stock currently trading around $131, well above the classic pivot, the near term structure looks constructive, though a retreat back below $121 would suggest the recent bounce is losing steam.
Moving Averages: Short Term Strength, Long Term Caution
Moving averages for MSTR currently show a classic recovery pattern, where the shorter term trend has already turned up while the longer term trend has not yet caught up. The 20 day, 30 day, 50 day, and 100 day simple and exponential moving averages are all now below the current price and signaling buy, with the 20 day EMA at $124.27 and the 50 day EMA at $117.04.
The 200 day averages still reflect the severity of the prior decline, with the 200 day EMA at $152.95 and the 200 day SMA at $138.03, both still above the current price and signaling sell. The overall moving average summary leans bullish, with 10 buy signals against 4 sell signals and 1 neutral, a meaningfully more constructive picture than the mixed readings often seen in stocks earlier in a recovery attempt. If the 200 day averages can be reclaimed, that would mark a significant technical milestone confirming the longer term trend has genuinely turned.
Momentum Oscillators: Neutral With Room to Run
Momentum readings for MSTR are largely neutral, which is a healthy sign after a rally of this size. The Relative Strength Index sits at 56.97, comfortably below the 70 level associated with overbought conditions. The Stochastic oscillator reads 52.57, also squarely in neutral territory.
The Commodity Channel Index at 58.96 and Average Directional Index at 39.84 point to a moderate uptrend without extreme conditions in either direction. MACD Level is positive at 8.24, a buy signal, though Momentum itself reads negative at -6.43, a sell signal, another example of short term indicators giving mixed short term readings even as the broader oscillator picture stays neutral to constructive. With 9 neutral readings against just 1 sell and 1 buy among the oscillators, there appears to be room for the rally to extend before the stock becomes technically overbought.
Volume and Analyst Sentiment
Volume during the latest session came in below the 30 day average, at 19.47 million shares versus 24.32 million, suggesting the recent rebound has not required unusually heavy buying to sustain itself so far. This is generally viewed as a healthier pattern than a rally built entirely on short term spikes in volume.
Analyst sentiment is dramatically bullish. Of 21 analysts who have rated MSTR in the past three months, 17 rate it strong buy and 2 rate it buy, versus just 2 hold ratings and zero sell or strong sell ratings anywhere on the list. The average price target of $232.17 implies about 77 percent upside from current levels, with estimates ranging from a low of $125 to a high of $435. This level of analyst conviction is unusual and reflects a view that the stock's underlying Bitcoin holdings, and the company's ability to keep raising capital against them, justify a much higher valuation than the market currently assigns.
Fundamental Snapshot Behind the Chart
MSTR's fundamentals look unusual compared to a typical large cap, precisely because its financial results are dominated by Bitcoin holding gains and losses rather than core software operations. The company carries a market capitalization of about $50.32 billion, with trailing twelve month revenue of just $477.23 million, a small figure for a company of this size, and a net loss of $3.85 billion for the fiscal year, driven largely by Bitcoin related accounting charges.
Basic EPS over the trailing twelve months sits at a loss of $96.33 per share, another figure shaped heavily by Bitcoin fair value accounting rather than the operating software business. Looking ahead, analysts model EPS of $12.34 and revenue of roughly $128.05 million for the next reported quarter, though given how much these numbers can swing with Bitcoin's price, traders should treat them with caution. MSTR does not pay a dividend and has no current plans to start one. The next earnings report is expected around November 4, 2026, covering Q3 2026.
The Bitcoin Connection and What It Means for the Chart
The single most important driver of MSTR stock is Bitcoin itself. The company recently published a Bitcoin guide detailing its common and preferred shares tied to its BTC treasury strategy, explicitly noting that the business benefits from rising Bitcoin prices while also flagging related conflict risks. This kind of direct acknowledgment shows just how tightly the stock's fortunes are now bound to crypto market conditions rather than traditional software fundamentals.
From a technical standpoint, this means MSTR chart patterns should generally be read alongside Bitcoin's own price action rather than in isolation. The recent bounce off the yearly lows lines up with a broader stabilization in crypto markets, and further upside in MSTR likely depends heavily on Bitcoin holding its own recent gains or extending them. Any renewed weakness in Bitcoin would likely pressure MSTR shares more severely than it would a typical technology stock, given the company's leveraged exposure.
Volatility and Risk Considerations
Risk is the central theme of any MSTR stock analysis. The stock carries a beta of 2.77, meaning it has historically moved nearly three times as much as the broader market, and the past year's 60 percent decline shows just how severe that volatility can get in practice. Because the company has financed much of its Bitcoin buying with debt and convertible securities, a sustained drop in Bitcoin's price could pressure the company's balance sheet in ways that go beyond simple stock price volatility.
Traders should also recognize that MSTR's traditional valuation metrics, such as its deeply negative EPS, are not comparable to those of an operating software company and are largely a function of Bitcoin accounting rules. This makes the stock better understood as a leveraged Bitcoin proxy than as a conventional enterprise software investment, and position sizing should reflect both the equity market risk and the underlying crypto market risk simultaneously.
Conclusion
Putting the full picture together, MSTR stock technical analysis shows a stock in the early stages of a recovery attempt after a severe decline. Short and medium term moving averages have turned bullish, oscillators remain neutral with room to extend higher, and a 34 percent monthly rally has already reclaimed a meaningful chunk of the stock's losses. At the same time, the 200 day moving averages still reflect the prior downtrend, the stock remains down 60 percent over the past year, and its fortunes are tied directly to Bitcoin's own price swings.
For traders, the $121 pivot area is the level to watch on the downside, while a sustained move above the 200 day moving averages near $138 to $153 would mark a more decisive technical turnaround. As always, combining this technical picture with Bitcoin's own price trend will offer the clearest read on where MSTR heads next, since this stock is unlikely to move independently of crypto market sentiment for as long as its balance sheet remains built around Bitcoin. Traders following MSTR as a Bitcoin proxy may also want to keep an eye on how sentiment develops on platforms like MEXC, where Bitcoin and a wide range of related crypto assets trade around the clock.
FAQ
Is MSTR stock a buy right now based on technical analysis?
The technical picture has turned more constructive, with short and medium term moving averages signaling buy and oscillators still neutral rather than overbought. However, the 200 day moving averages remain bearish and the stock is still down sharply over the past year, so many traders treat this as an early stage recovery to watch rather than a guaranteed buy signal.
What is the current MSTR stock price target?
The average one year analyst price target for MSTR is $232.17, based on estimates from 18 analysts, implying about 77 percent upside from the current price. Targets range from a low of $125 to a high of $435.
Why is MSTR stock down so much over the past year?
MSTR stock fell 60.08 percent over the past year largely because the company's balance sheet is dominated by Bitcoin holdings, and Bitcoin itself pulled back sharply from its highs during that period. Since MSTR behaves like a leveraged proxy for Bitcoin, its stock price swings tend to be larger than Bitcoin's own moves in both directions.
What are the key support and resistance levels for MSTR stock?
Near term support sits around $121, the classic pivot point, with deeper support near $103 and $72 in a more severe pullback. Resistance is concentrated in the $151 to $170 zone, with the 200 day moving averages near $138 to $153 representing an important longer term hurdle.
Is MSTR stock volatile?
Yes, extremely. MSTR carries a beta of 2.77 and has traded between roughly $100 and above $300 over the past year. The stock's fortunes are closely tied to Bitcoin's own price swings, which adds an additional layer of volatility beyond typical equity market risk.
Does MSTR pay a dividend?
No. MSTR has never paid a dividend and has no current plans to start one. The company's financial strategy is centered on accumulating Bitcoin rather than returning capital to shareholders.
Disclaimer
This article is for informational and educational purposes only and does not constitute financial, investment, or trading advice. Technical analysis reflects historical price patterns and indicators, which do not guarantee future performance. Stock prices, indicators, and analyst estimates referenced here change frequently and may no longer be accurate by the time you read this. Cryptocurrency linked equities such as MSTR carry additional risk tied to the underlying crypto asset's own volatility. Always conduct your own research and consult a licensed financial advisor before making any investment decisions. Trading stocks and other financial instruments carries risk, including the potential loss of principal.



