


Introduction to Technical Analysis for TUX Project (TUXC) Trading
Technical indicators are mathematical tools used to analyze price movements and trading volumes in cryptocurrency markets, helping traders identify patterns and forecast future price action. For the TUX Project (TUXC), technical analysis is especially relevant due to its unique volatility and 24/7 trading environment, which generates continuous data streams ideal for indicator-based strategies. These tools complement fundamental analysis—which focuses on TUX Project's blockchain innovations and social impact mission—by providing actionable signals based on market sentiment and historical TUXC price behavior.
Example:
Technical analysis involves studying TUX Project (TUXC) price movements and trading volumes to identify predictive patterns. For traders, these indicators provide timing signals for entry and exit points without requiring deep knowledge of the TUXC token's technology. While fundamental analysis examines the TUX Project's innovations and real-world applications, technical analysis focuses on market sentiment and price direction based on historical data. TUX Project markets display distinct volatility patterns that make them suitable for technical analysis. With 24/7 trading across global exchanges, TUXC creates continuous data streams that technical indicators can effectively analyze. The most relevant tools include trend-following indicators, momentum oscillators, and volume metrics that help navigate TUX Project's unique market dynamics.
Essential Price-Based Indicators for TUX Project (TUXC)
- Moving Averages (Simple, Exponential):
These smooth out price data to reveal underlying trends. For the TUX Project, the 50-day and 200-day Simple Moving Averages (SMA) are commonly used to identify support and resistance levels. The golden cross (50-day SMA crossing above 200-day SMA) signals bullish momentum, while the death cross indicates bearish shifts. Exponential Moving Averages (EMA) give more weight to recent prices, making them more responsive to TUXC's fast-moving market. - Bollinger Bands:
Bollinger Bands use a 20-day moving average with bands set at two standard deviations. For TUX Project (TUXC), these bands help measure volatility and identify potential price breakouts. When price touches the upper band, it may indicate overbought conditions; the lower band suggests oversold conditions. Traders watch for Bollinger Band squeezes as signals of upcoming large TUXC price movements. - Support and Resistance Levels:
These are price points where TUX Project historically reverses direction. Identifying these levels helps traders anticipate potential entry and exit points based on past TUXC price action. - Fibonacci Retracement:
This tool identifies potential reversal points by measuring the magnitude of TUX Project's price moves and applying key ratios (23.6%, 38.2%, 61.8%). Traders use these levels to spot areas where TUXC may bounce or reverse.
Example:
Moving Averages serve as fundamental tools, with 50-day and 200-day SMAs indicating key support and resistance levels. The 'golden cross' (50-day crossing above 200-day) signals bullish trends for TUX Project (TUXC), while the 'death cross' indicates bearish shifts. Exponential Moving Averages give more weight to recent prices, making them responsive to TUXC's fast-moving conditions. Bollinger Bands (20-day moving average with bands at two standard deviations) help identify potential volatility changes in TUX Project's price. When price touches the upper band, it may indicate overbought conditions, while the lower band might suggest oversold conditions. TUXC traders watch for 'Bollinger Band squeezes' as potential indicators of upcoming large price movements in the TUX Project.
Volume and Momentum Indicators for TUX Project (TUXC)
- Volume Analysis:
Confirms the strength of TUX Project price movements. High volume supports genuine TUXC breakouts, while low volume suggests weak trends. Volume spikes often coincide with major TUX Project announcements or new TUXC listings. - Relative Strength Index (RSI):
RSI measures the speed and change of TUXC price movements on a 0-100 scale. Readings above 70 indicate overbought conditions; below 30 suggest oversold. TUX Project traders watch for RSI divergences, where price makes a new high but RSI does not, signaling potential reversals. - MACD (Moving Average Convergence Divergence):
MACD tracks momentum shifts by comparing short- and long-term moving averages. Crossovers and divergences help spot changes in TUX Project's trend direction. - On-Balance Volume (OBV):
OBV aggregates volume to detect "smart money" movements. Rising OBV with rising price suggests TUXC accumulation; falling OBV with falling price indicates distribution.
Example:
Volume analysis confirms TUX Project (TUXC) price movements, with strong volume supporting genuine breakouts while low volume suggests weak trends. Volume spikes often coincide with major TUX Project announcements or exchange listings. Traders should note divergences between price and volume, such as new highs on declining volume, which may signal weakening TUXC momentum. The RSI measures price movement speed on a 0-100 scale, with readings above 70 indicating overbought conditions and below 30 suggesting oversold conditions. TUX Project traders watch for RSI divergences where price makes a new high while RSI doesn't, potentially signaling a reversal. During strong bull markets, RSI may remain overbought for extended periods in TUXC trading.
Advanced Technical Indicators for TUX Project (TUXC) Trading
- Ichimoku Cloud:
Provides a comprehensive view of TUX Project's trend, support, and resistance. Trading above the cloud signals bullishness; below, bearishness. Cloud thickness indicates strength of support/resistance, and color changes may signal TUXC trend shifts. - Stochastic Oscillator:
Helps time market entries and exits by comparing TUXC's closing price to its price range over a set period. Overbought and oversold readings guide short-term TUX Project trading decisions. - Accumulation/Distribution Line:
Gauges buying and selling pressure by combining price and volume data. Rising A/D line suggests TUX Project accumulation; falling line indicates TUXC distribution. - Average Directional Index (ADX):
Measures the strength of TUX Project's trend, regardless of direction. Readings above 25 indicate strong TUXC trends; below 20 suggest sideways movement. ADX helps traders decide whether to use trend-following or range-trading strategies for TUXC.
Example:
The Ichimoku Cloud provides a comprehensive market view through multiple components. When TUX Project trades above the cloud, the trend is bullish; when below, bearish. Cloud thickness indicates strength of support/resistance, while color changes signal potential TUXC trend shifts. The ADX measures trend strength regardless of direction, helping TUX Project traders determine whether a market is trending strongly (readings above 25) or moving sideways (below 20). This guides whether to use trend-following or range-trading approaches. Combined with DMI indicators, ADX can also signal potential trend reversals when these lines cross in TUXC trading.
Creating a Technical Analysis Strategy for TUX Project (TUXC)
- Combining Multiple Indicators:
Use trend, momentum, and volume indicators together for more reliable TUX Project trading signals. This multi-layered approach filters out false signals during volatile TUXC phases. - Avoiding Redundancy:
Select indicators that provide unique insights to prevent information overload and conflicting signals when analyzing the TUX Project. - Backtesting Strategies:
Apply your technical analysis methods to historical TUXC price data to validate their effectiveness before live trading TUX Project tokens. - Custom Indicators and Alerts:
Set up personalized parameters and alerts on trading platforms to optimize for TUX Project's specific market behavior. - Adapting to Market Conditions:
Test strategies across different TUXC market phases to ensure robustness and adaptability for TUX Project trading.
Example:
Effective strategies combine multiple indicators to confirm signals from different perspectives. Pairing trend indicators like Moving Averages with momentum oscillators like RSI and volume indicators provides a more comprehensive view, filtering out false signals during TUX Project's volatile phases. Backtesting validates strategies before live trading by applying them to historical TUXC data. Trading platforms offer tools to adjust parameters like moving average periods to optimize for TUX Project's specific behavior. Focus on testing across various market conditions rather than cherry-picking favorable periods, ensuring your strategy works across TUXC's cyclical market phases.
Conclusion
Technical indicators provide valuable insights for timing TUX Project trades, but should be combined with proper risk management for optimal results. No indicator is infallible—especially in TUXC's volatile market—which is why diversifying your analytical approach is crucial. To put these techniques into practice, MEXC offers a comprehensive trading platform with advanced charting tools and real-time TUX Project (TUXC) data. For the latest price analysis, detailed charts, and up-to-date predictions on TUXC's future movements, visit our MEXC TUXC Price Page, where you can monitor TUX Project market trends and make informed trading decisions.
Deskripsi: Crypto Pulse didukung oleh AI dan sumber publik untuk menghadirkan tren token terpopuler secara instan kepada Anda. Untuk mendapatkan wawasan ahli dan analisis mendalam, kunjungi MEXC Learn.
Artikel-artikel yang dibagikan di halaman ini bersumber dari platform publik dan disediakan hanya sebagai informasi. Artikel-artikel tersebut belum tentu mewakili pandangan MEXC. Seluruh hak cipta tetap dimiliki oleh penulis aslinya. Jika Anda meyakini bahwa ada konten yang melanggar hak pihak ketiga, silakan hubungi [email protected] agar konten tersebut segera dihapus.
MEXC tidak menjamin keakuratan, kelengkapan, atau keaktualan konten apa pun dan tidak bertanggung jawab atas tindakan apa pun yang dilakukan berdasarkan informasi yang diberikan. Konten tersebut bukan merupakan saran keuangan, hukum, atau profesional lainnya, juga tidak boleh ditafsirkan sebagai rekomendasi atau dukungan oleh MEXC.
Pelajari Humanity Selengkapnya
Lihat Selengkapnya
Cara Membaca RSI Solana: Nilai Saat Ini, Sinyal Grafik, dan Analisis MACD

Indikator RSI Ethereum: Cara Membaca Level Overbought dan Oversold ETH

Berapa Harga Bitcoin di Tahun 2030? Prediksi Harga & Analisis dari Para Ahli
Info Humanity Terkini
Lihat Selengkapnya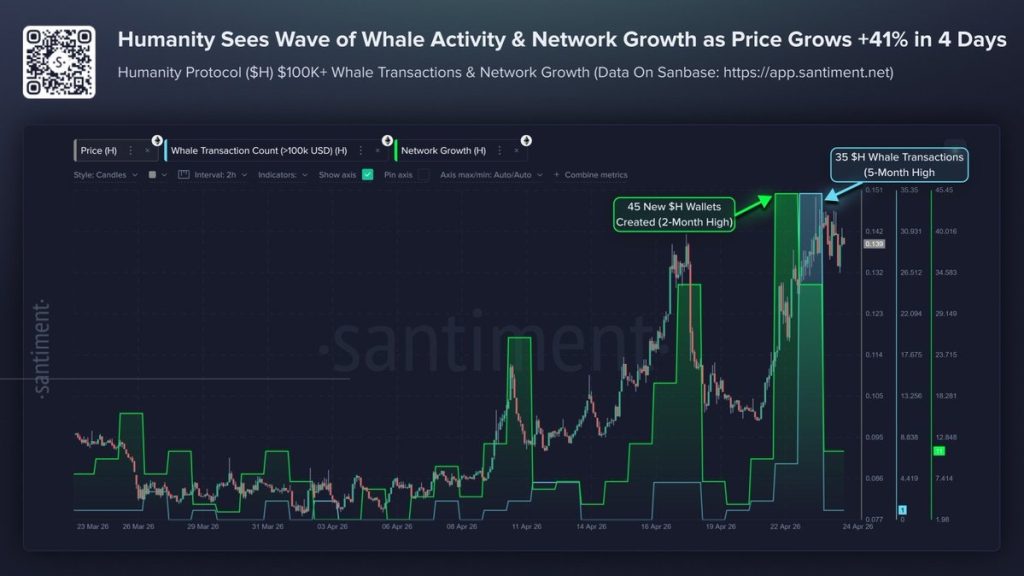
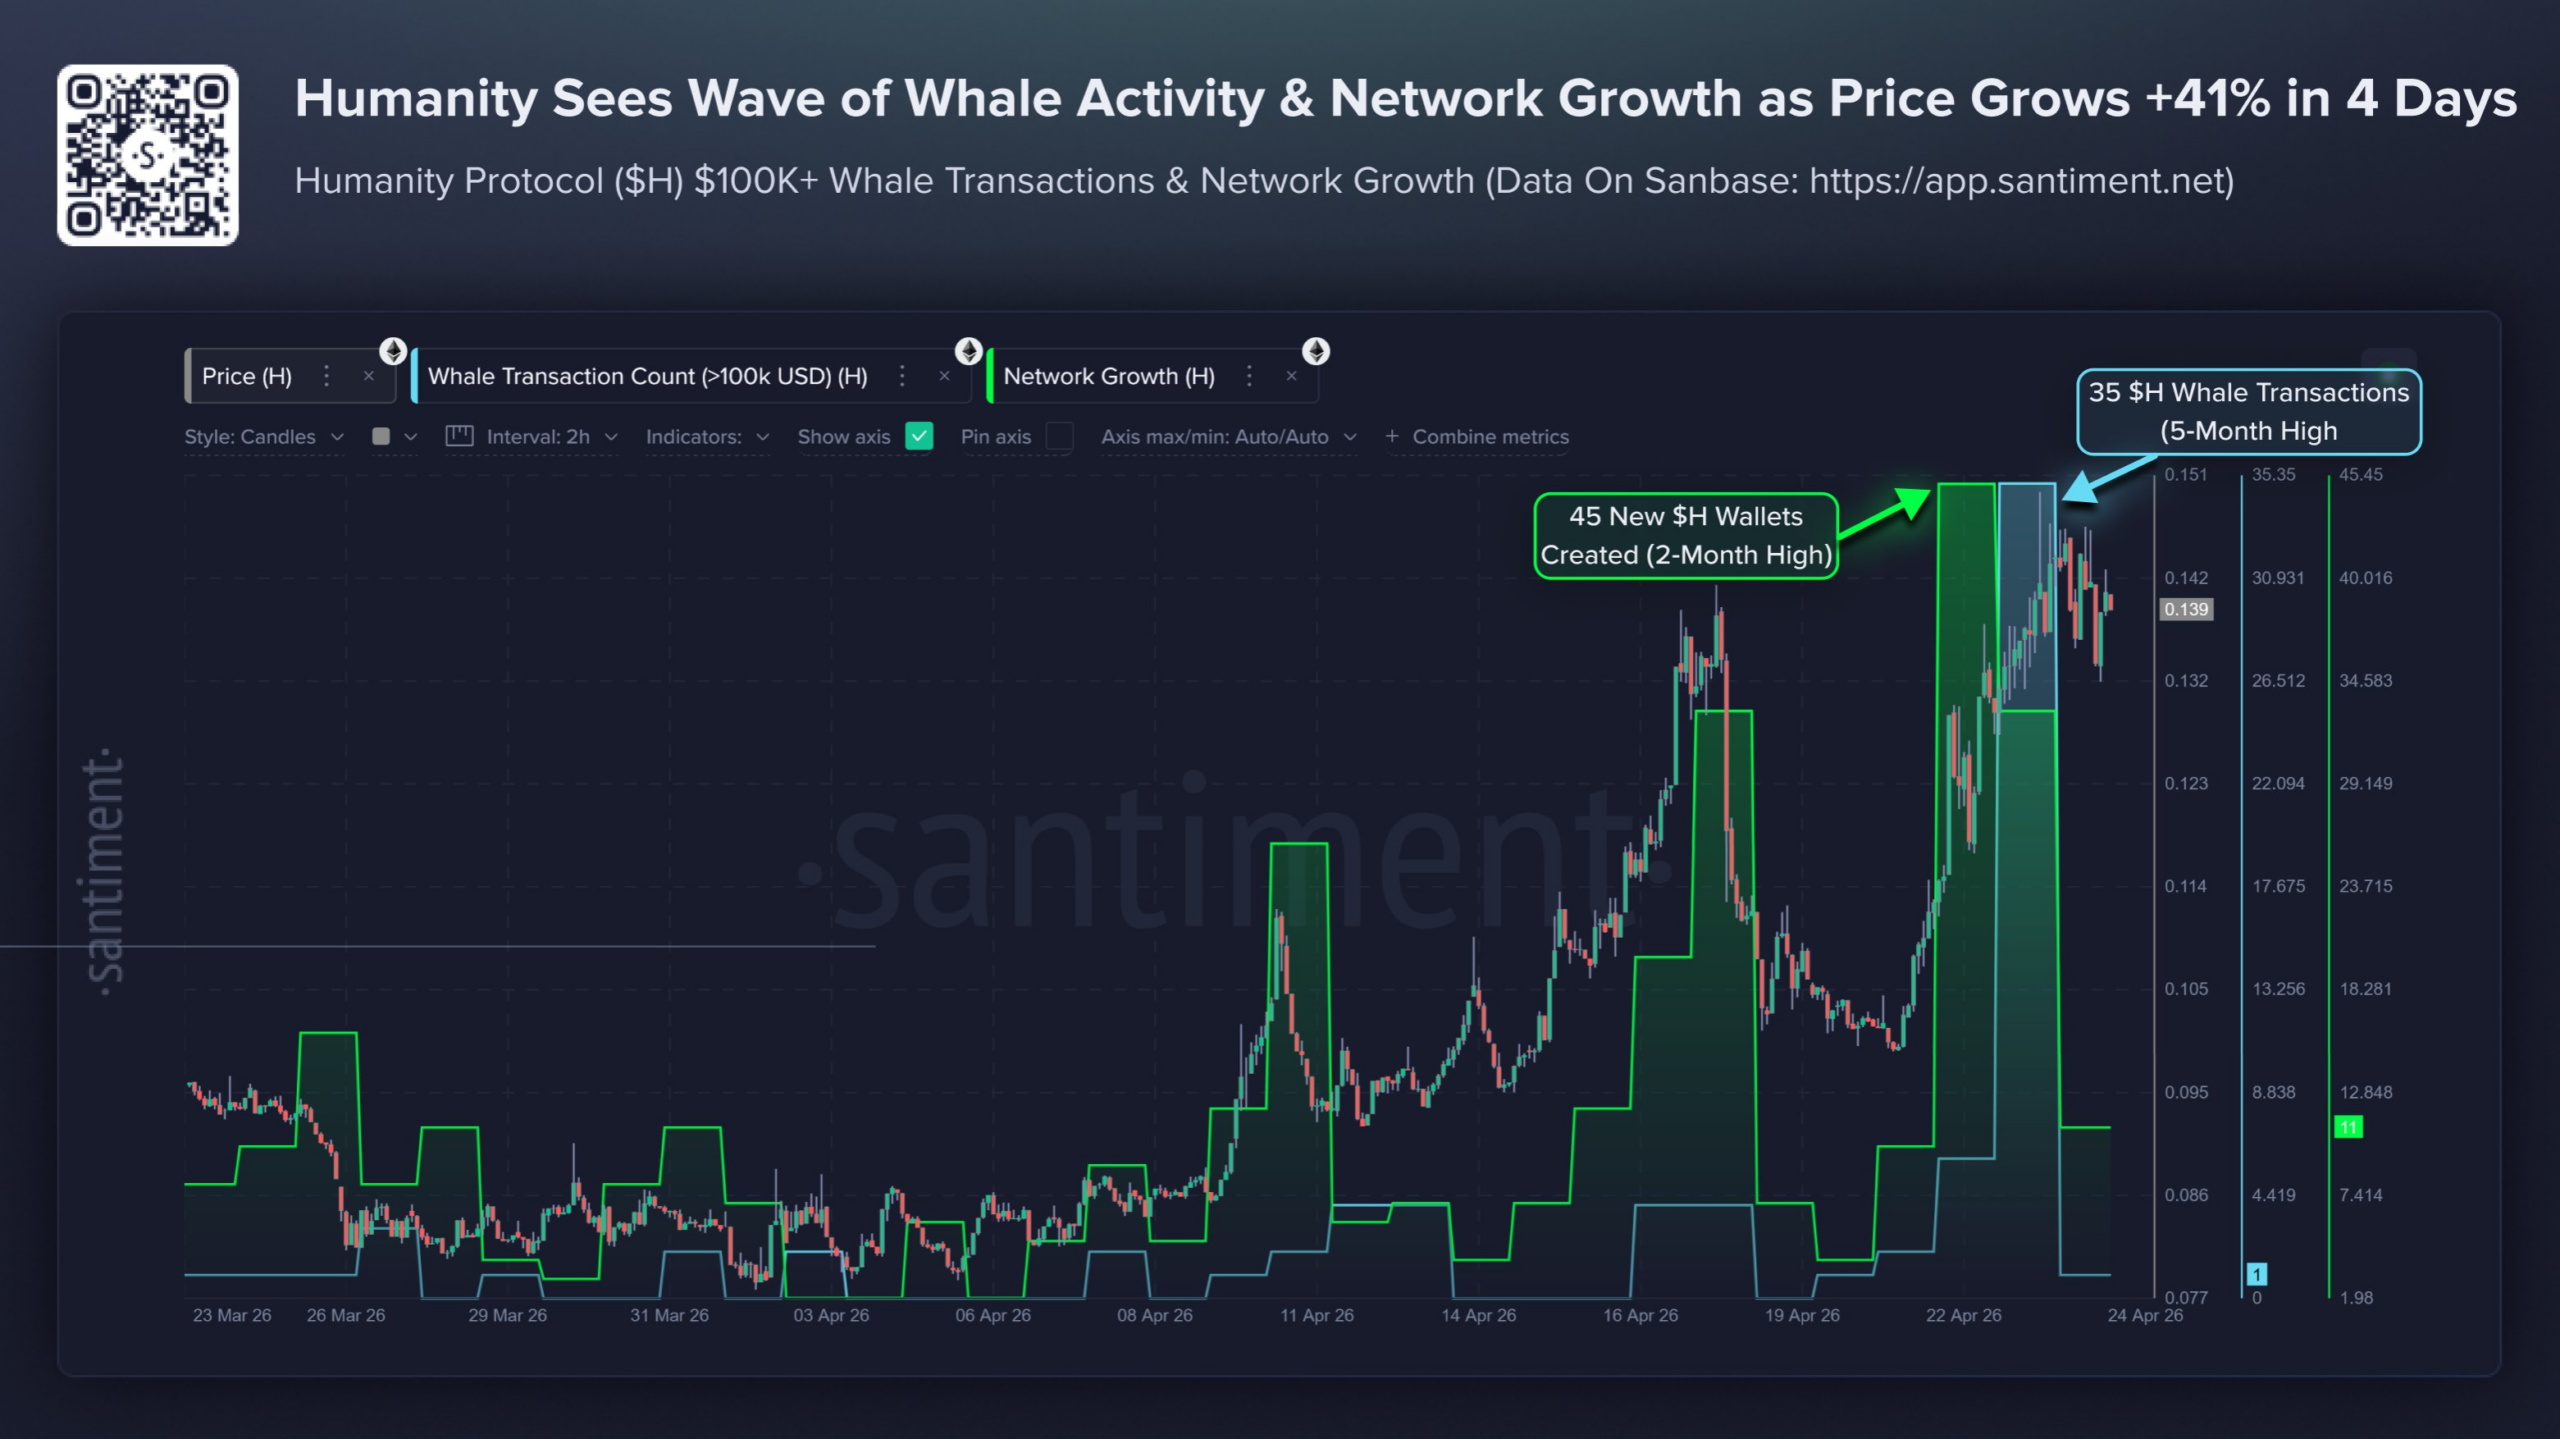
Transaksi Whale Humanity Protocol (H) Mencapai Tertinggi 5 Bulan – Begini Dampaknya terhadap Harga

$H, $M, dan $PENGU Unggul dalam Daftar Kripto dengan Kenaikan Tertinggi Minggu Ini
Token Ini Naik 40% dalam Seminggu, Efek Kejatuhan Worldcoin
POPULER
Mata uang kripto yang sedang tren saat ini dan menarik perhatian pasar yang signifikan
Harga Kripto
Mata uang kripto dengan volume trading tertinggi
Baru Ditambahkan
Mata uang kripto yang baru saja masuk listing dan tersedia untuk trading