


Understanding the Key Factors Influencing the Price of SHARDS
The price of SHARDS demonstrates significant volatility, as is common among digital assets in the cryptocurrency market. As the native utility token of the WorldShards Protocol, SHARDS experiences price fluctuations influenced by a range of interconnected factors. From tokenomics and distribution mechanisms to market sentiment and technical indicators, understanding these elements is crucial for anyone navigating the often unpredictable crypto landscape. For both newcomers and experienced traders in the SHARDS ecosystem, identifying and analyzing these price influencers provides essential context for investment decisions and helps distinguish between short-term price noise and genuine value signals. This comprehensive guide explores the major factors that drive SHARDS's price movements, providing the analytical foundation needed to make more informed decisions in this innovative sector at the intersection of Web3 identity and reputation systems.
Market Fundamentals: Supply, Demand, and Tokenomics
- Supply and circulation dynamics (maximum supply, circulating supply, token burns)
- Demand factors and investor interest
- Token utility and real-world use cases
- Tokenomics structure and distribution mechanisms
SHARDS's price is fundamentally governed by its fixed total supply of 1,000,000,000 tokens. The WorldShards tokenomics structure features a carefully designed distribution model: 46.64% allocated to the ecosystem, 10.51% to early investors, 10% to liquidity, 10% to operational expenses, 8% to the team, 5% to advisory, 4% to reserve, 4% to community sale, and 1.85% to a strategic round. This approach ensures balanced ecosystem growth while maintaining sufficient market liquidity. The demand side is driven by SHARDS's role as the fuel for verifiable identity, reputation-based rewards, and user-aligned governance across WorldShards. As the SHARDS Protocol ecosystem expands, the token's utility value increases, creating natural demand pressure that can positively impact price.
Technical Indicators and Market Sentiment
- Key technical analysis metrics for SHARDS
- Price charts, patterns, and significant support/resistance levels
- Social media sentiment and community growth
- Market psychology: Fear, greed, and herd behavior impacts
Technical analysis of SHARDS often focuses on key support and resistance levels derived from historical price action, moving averages that highlight momentum shifts, and volume indicators that validate price movements. These metrics help traders identify potential reversal patterns or continuation signals that often precede significant upward or downward price movements. SHARDS's price movements are particularly sensitive to social media discourse and community sentiment, given WorldShards' foundation as a Web3 recognition-based economy. Market psychology plays a crucial role, with fear and greed cycles often amplifying price movements beyond what fundamentals might suggest. During periods of market-wide enthusiasm, SHARDS may experience accelerated price growth due to its innovative positioning, while broader market downturns can trigger disproportionate selling despite unchanged fundamentals.
External Catalysts and Market Developments
- Major partnerships and technological milestones
- Industry trends and competitive positioning
- Macroeconomic influences and regulatory developments
- Integration announcements and enterprise adoption
Strategic partnerships and technological milestones significantly impact SHARDS's valuation, especially collaborations that expand the WorldShards protocol's reach or user base. Each major integration or partnership announcement typically creates immediate positive price pressure, while successful product implementations sustain longer-term price support. SHARDS's price is also influenced by its positioning relative to other Web3 and reputation-based projects, as well as the growing demand for decentralized identity and reputation solutions. Regulatory developments and broader macroeconomic trends, such as inflation rates or interest rate changes, also influence investment flows into SHARDS.
On-Chain Metrics and Network Activity
- Blockchain transaction volumes and wallet growth analysis
- Active addresses and network usage statistics
- Smart contract interactions and developer activity
- Staking statistics and network security metrics
Blockchain analytics reveal crucial insights about SHARDS's adoption through transaction volume trends and wallet address growth patterns. Increasing daily active addresses often precedes positive price movements, while declining transaction counts may signal waning interest or potential price corrections. The health of the WorldShards ecosystem can be assessed through smart contract interactions and developer activity, providing objective measures of platform development progress and user engagement. For tokens with staking mechanisms, metrics such as total value locked (TVL) and staking participation rates offer insights into holder confidence and selling pressure resistance. Higher staking percentages generally indicate stronger holder conviction and reduced selling pressure, potentially supporting price stability or gradual appreciation during market fluctuations.
Conclusion
Successfully analyzing SHARDS's price movements requires synthesizing multiple factors rather than isolated metrics. By combining tokenomics fundamentals, technical indicators, market sentiment, and on-chain metrics, investors can build a holistic view of what truly drives SHARDS's value. Understanding these price factors creates the foundation for effective trading strategies. To put this knowledge into action, our 'SHARDS Trading Complete Guide' provides practical steps to implement these insights in real trading scenarios. Explore everything from setting up your first position to managing risk effectively, and start navigating the dynamic WorldShards market with confidence today.
Deskripsi: Crypto Pulse didukung oleh AI dan sumber publik untuk menghadirkan tren token terpopuler secara instan kepada Anda. Untuk mendapatkan wawasan ahli dan analisis mendalam, kunjungi MEXC Learn.
Artikel-artikel yang dibagikan di halaman ini bersumber dari platform publik dan disediakan hanya sebagai informasi. Artikel-artikel tersebut belum tentu mewakili pandangan MEXC. Seluruh hak cipta tetap dimiliki oleh penulis aslinya. Jika Anda meyakini bahwa ada konten yang melanggar hak pihak ketiga, silakan hubungi [email protected] agar konten tersebut segera dihapus.
MEXC tidak menjamin keakuratan, kelengkapan, atau keaktualan konten apa pun dan tidak bertanggung jawab atas tindakan apa pun yang dilakukan berdasarkan informasi yang diberikan. Konten tersebut bukan merupakan saran keuangan, hukum, atau profesional lainnya, juga tidak boleh ditafsirkan sebagai rekomendasi atau dukungan oleh MEXC.
Pelajari Humanity Selengkapnya
Lihat Selengkapnya
Cara Membaca RSI Solana: Nilai Saat Ini, Sinyal Grafik, dan Analisis MACD
Indikator RSI Ethereum: Cara Membaca Level Overbought dan Oversold ETH

Berapa Harga Bitcoin di Tahun 2030? Prediksi Harga & Analisis dari Para Ahli
Info Humanity Terkini
Lihat Selengkapnya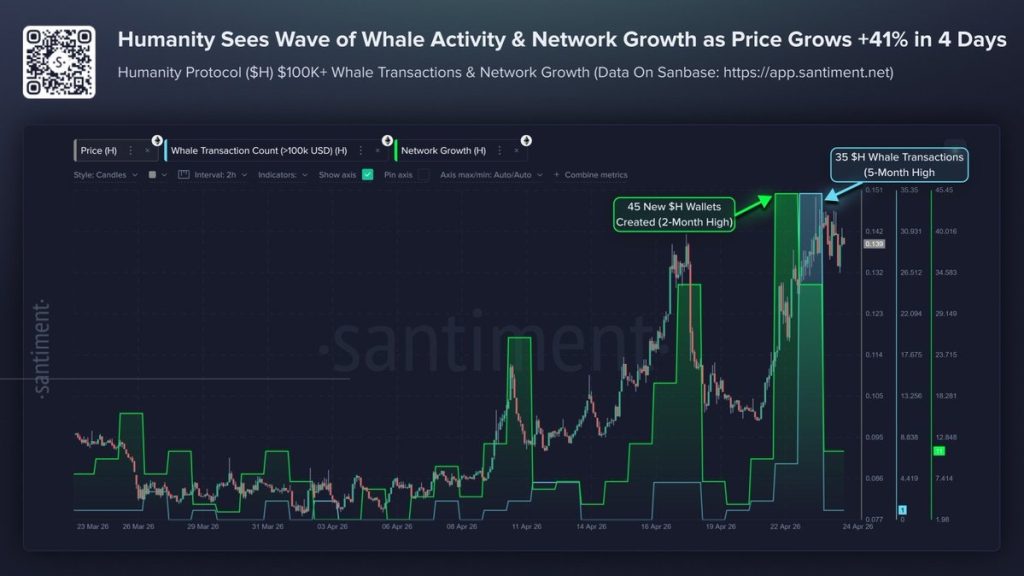
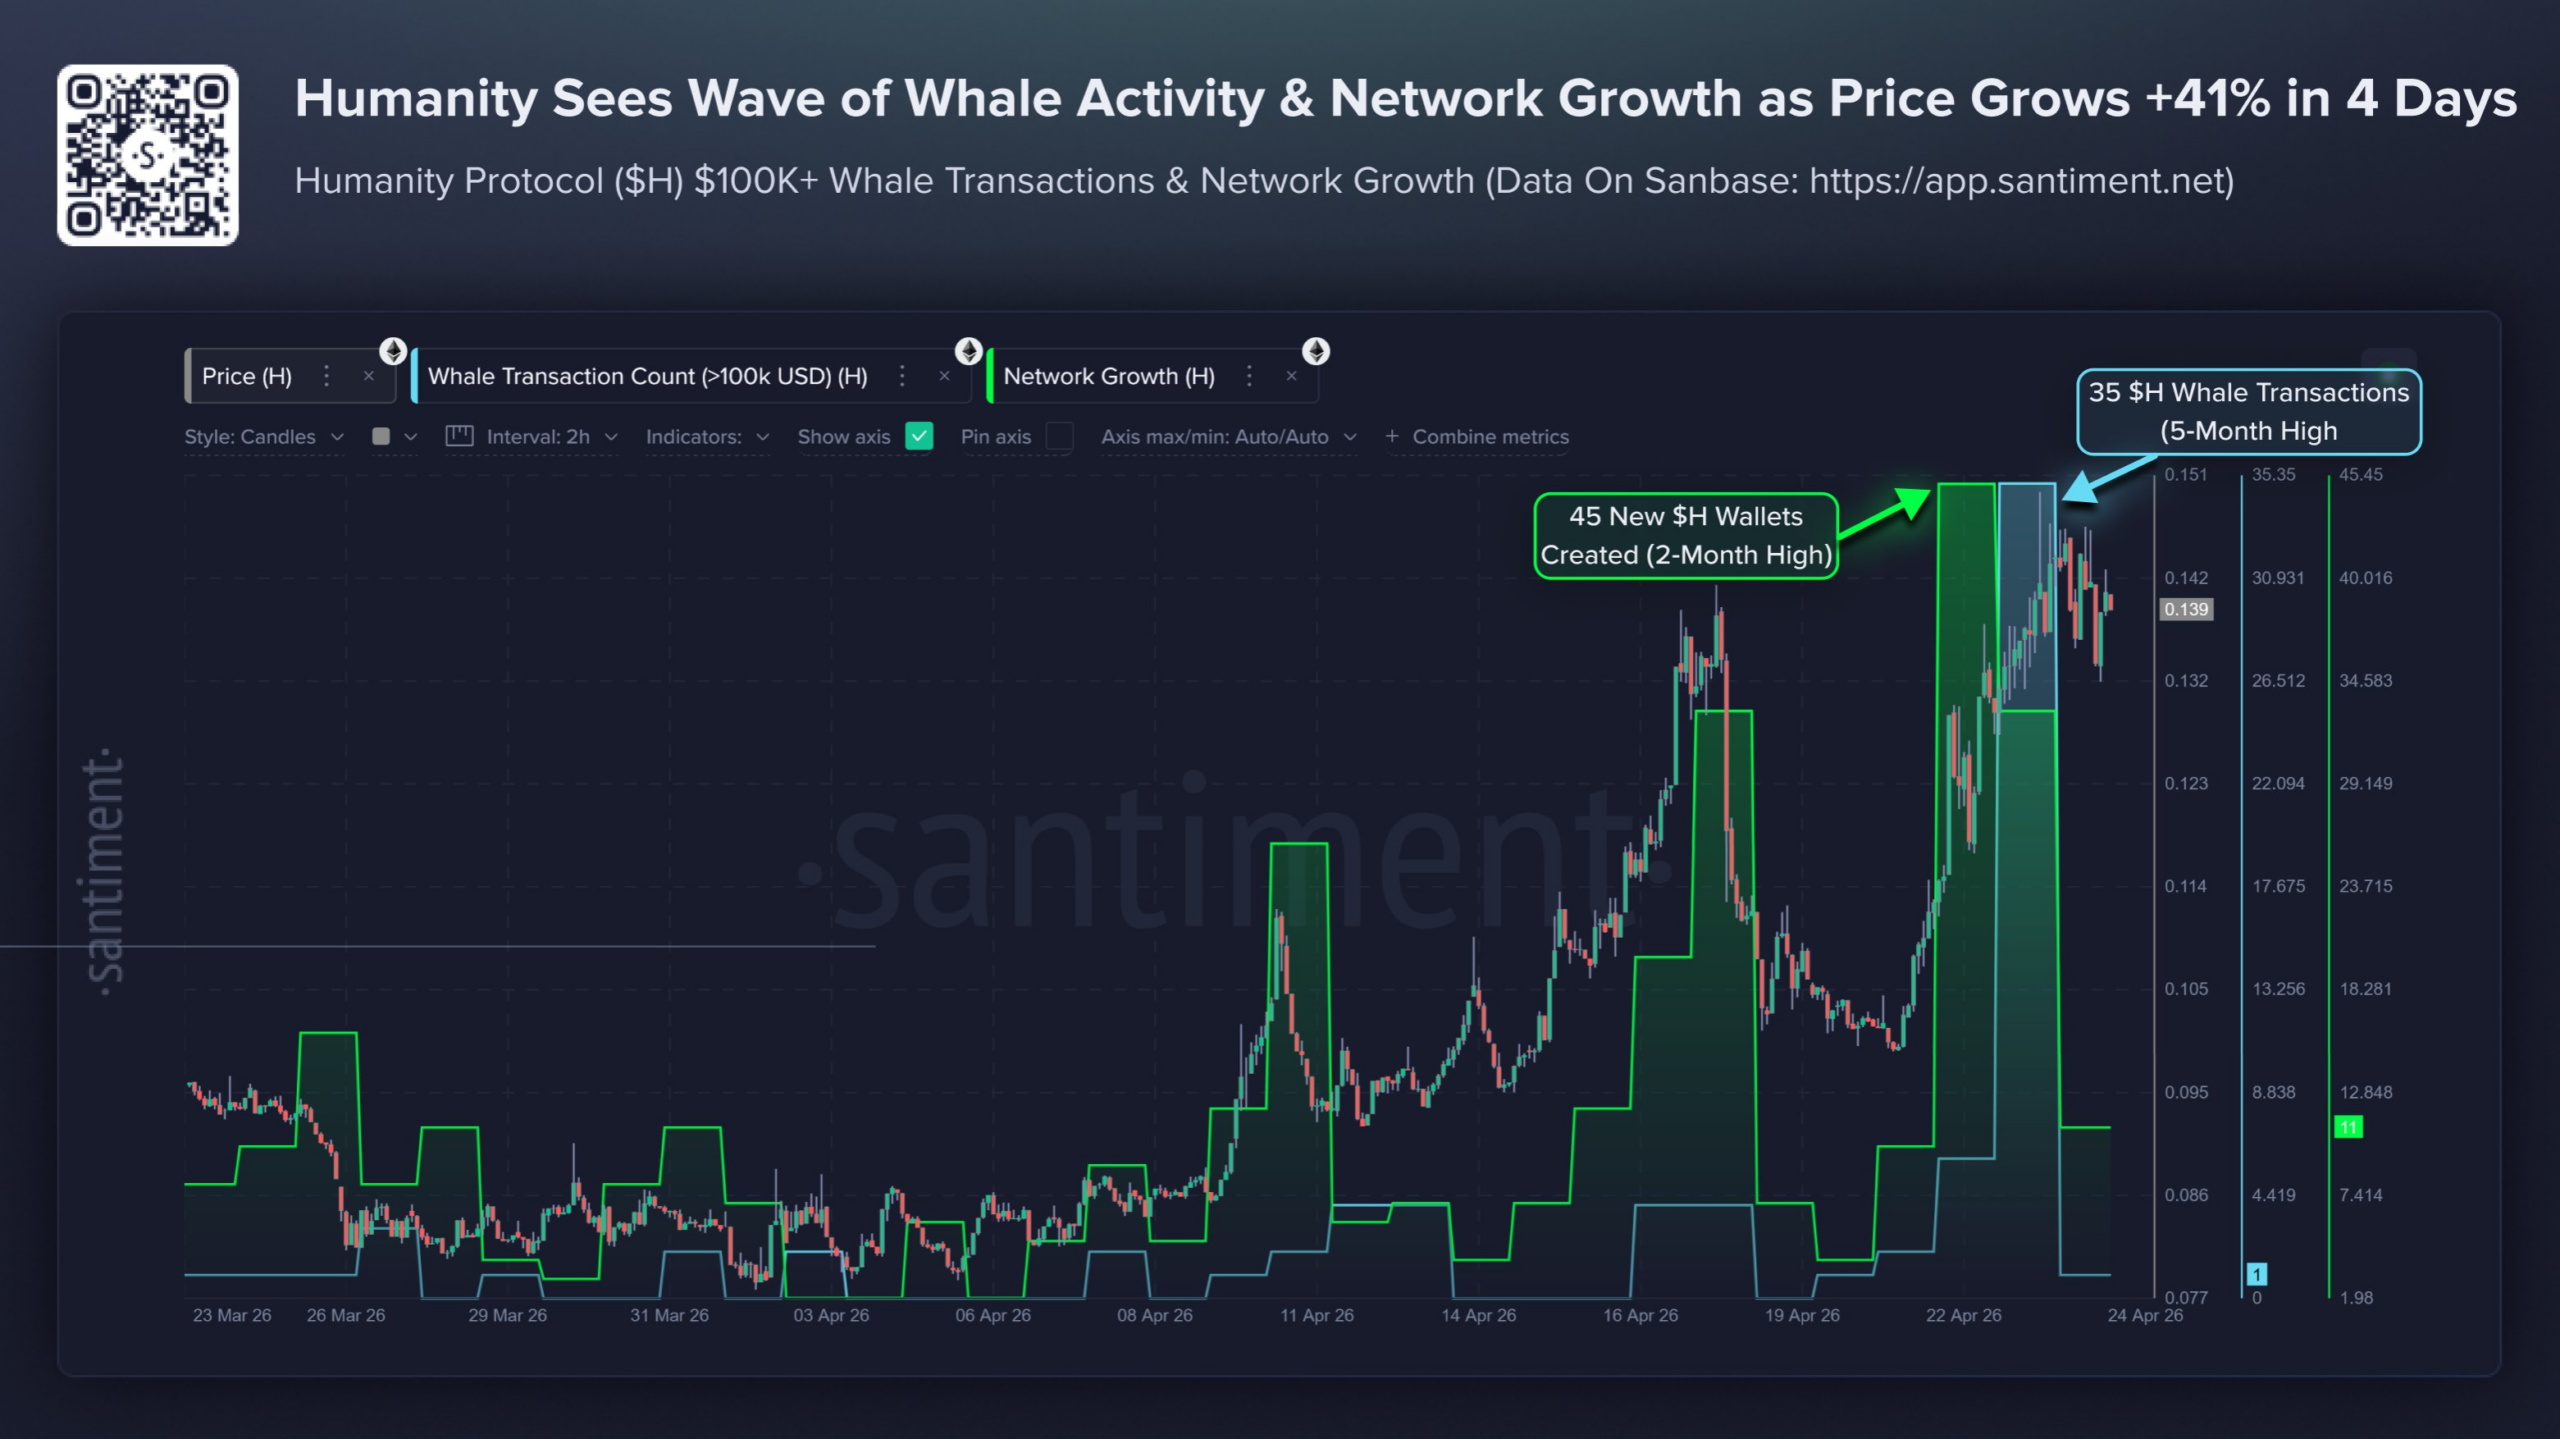
Transaksi Whale Humanity Protocol (H) Mencapai Tertinggi 5 Bulan – Begini Dampaknya terhadap Harga

$H, $M, dan $PENGU Unggul dalam Daftar Kripto dengan Kenaikan Tertinggi Minggu Ini
Token Ini Naik 40% dalam Seminggu, Efek Kejatuhan Worldcoin
POPULER
Mata uang kripto yang sedang tren saat ini dan menarik perhatian pasar yang signifikan
Harga Kripto
Mata uang kripto dengan volume trading tertinggi
Baru Ditambahkan
Mata uang kripto yang baru saja masuk listing dan tersedia untuk trading