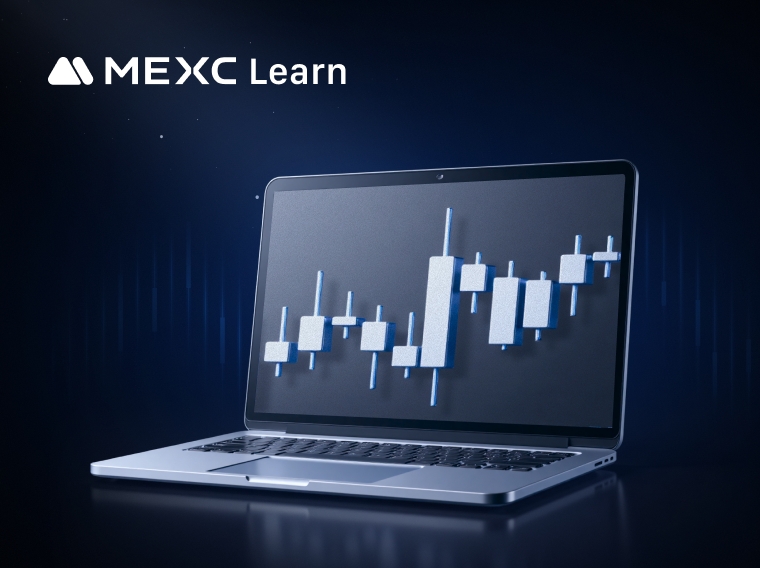
The Parabolic SAR (Stop and Reverse) is a widely used technical analysis tool designed to determine the direction of price trends and identify potential reversal points. This indicator plots a seriesThe Parabolic SAR (Stop and Reverse) is a widely used technical analysis tool designed to determine the direction of price trends and identify potential reversal points. This indicator plots a series
Belajar/Trading Guide/Technical Indicators/What is Parabolic SAR?

What is Parabolic SAR?

Sep 21, 2026MEXC
3 menit

The Parabolic SAR (Stop and Reverse) is a widely used technical analysis tool designed to determine the direction of price trends and identify potential reversal points. This indicator plots a series of small dots on a price chart—positioned either above or below candlesticks—to help traders assess trend direction and establish stop-loss levels or target prices. Commonly applied in trend-following strategies, the Parabolic SAR enables traders to maintain positions during trends while providing timely signals for potential exits upon trend reversals.

Developed by renowned technical analyst J. Welles Wilder, the Parabolic SAR was introduced in his 1978 publication, New Concepts in Technical Trading Systems. This seminal work also introduced several other foundational indicators, including the Relative Strength Index (RSI), Average True Range (ATR), and Directional Movement Index (DMI), all of which remain widely utilized in modern trading strategies.


1. Core Principles of the Parabolic SAR Indicator


Trend Identification:

  • SAR dots below the price indicate an uptrend, suggesting a favorable environment for long positions.
  • SAR dots above the price signal a downtrend, indicating a potential opportunity for short positions.

Stop-Loss and Reversal Signals:

  • When SAR dots move closer to the price or are breached, it may suggest an impending trend reversal, prompting traders to reassess and adjust their positions accordingly.

Renowned for its clarity and ease of interpretation, the Parabolic SAR serves as a valuable tool for both novice and seasoned traders. Beyond offering a clear visualization of market trends, it also provides early reversal signals, enabling traders to optimize their strategies and adapt effectively to changing market conditions.

2. Advantages of the Parabolic SAR Indicator


The Parabolic SAR serves as a valuable tool for identifying market trend direction, duration, and potential reversals, enabling traders to optimize entry and exit points. Additionally, the indicator is widely used for dynamic stop-loss placement, allowing traders to adjust stop-loss levels in response to market trends. This approach, commonly known as a trailing stop, helps secure profits while effectively managing risk.

A key advantage of the Parabolic SAR is its ability to preserve gains by signaling trend reversals. By providing timely exit alerts, it prevents traders from exiting positions prematurely or entering the market too early, thereby enhancing overall trade efficiency.

3. Limitations of the Parabolic SAR Indicator


While highly effective in strongly trending markets, the Parabolic SAR loses accuracy in ranging or choppy conditions. During periods of market consolidation or low volatility, it can produce false reversal signals, potentially leading to unnecessary trade adjustments or losses.

The indicator’s sensitivity settings require careful adjustment. Higher sensitivity increases the likelihood of false signals, potentially resulting in premature position closures or profit-taking. Additionally, false bullish signals may foster overconfidence, prompting traders to enter positions at unfavorable price points.

Another limitation of the Parabolic SAR is that it does not factor in trading volume, which means it cannot assess trend strength directly. Although greater distance between SAR dots may suggest strong price movements, this does not always confirm trend sustainability. As a best practice, traders should combine the Parabolic SAR with other technical indicators to achieve a more comprehensive market analysis.

4. How to Use the Parabolic SAR Indicator on MEXC


To apply the Parabolic SAR on MEXC, follow these steps:
1) Open the MEXC SpotorFutures trading page.
2) Click the Indicators (Fx) button above the candlestick chart.
3) Navigate to the Main Index, and select SAR. Note: Click the SAR section on the left side if the menu doesn't immediately update.
4) Customize the Start, Increment, andMaximum parameters as needed.
5) Click Confirm to apply the Parabolic SAR to your trading chart.

Once enabled, Parabolic SAR dots will appear above or below price movements, assisting traders in identifying trend shifts, refining trading strategies, and managing risk more effectively.


Disclaimer: This information does not provide advice on investment, taxation, legal, financial, accounting, or any other related services, nor does it constitute advice to purchase, sell, or hold any assets. MEXC Learn provides information for reference purposes only and does not constitute investment advice. Please ensure you fully understand the risks involved and exercise caution when investing. The platform is not responsible for users' investment decisions.

Peluang Pasar
Logo ELYSIA
Harga ELYSIA(EL)
$0.001759
$0.001759$0.001759
+0.05%
USD
Grafik Harga Live ELYSIA (EL)

Artikel Populer

Lihat Selengkapnya
Pesaing Oura: Samsung, Apple, dan Pasar Smart Ring

Pesaing Oura: Samsung, Apple, dan Pasar Smart Ring

Menurut prospektus IPO-nya, pesaing Oura terbagi dalam tiga kelompok: pembuat jam tangan pintar seperti Apple, Google, dan Samsung; perangkat wearable kebugaran seperti Garmin, Coros, dan Whoop; serta
Apakah Oura Menguntungkan? Pendapatan, Model Bisnis, dan Valuasi

Apakah Oura Menguntungkan? Pendapatan, Model Bisnis, dan Valuasi

Ya, Oura menguntungkan berdasarkan laba bersih. Prospektus IPO-nya menunjukkan laba bersih sebesar $60,8 juta dari pendapatan $1,21 miliar dalam sembilan bulan hingga 30 Juni 2026. Kerugian $924,3 jut

Review Bitget 2026: Skor 3,8 dari 5, Copy Trading Paling Lengkap, dan Tiga Tanggal Penting Keluarnya Bitget dari Jepang

Review Bitget 2026: Skor 3,8 dari 5, Copy Trading Paling Lengkap, dan Tiga Tanggal Penting Keluarnya Bitget dari Jepang

Per 25 September 2026, Bitget meraih skor 3,8 dari 5 pada penilaian enam dimensi kami: unggul di derivatif, mendapat skor sementara 3,5 untuk keamanan setelah insiden hot wallet senilai sekitar US$351
IPO Oura 2026: Tanggal, Harga, Valuasi, dan Cara Dagang OURA

IPO Oura 2026: Tanggal, Harga, Valuasi, dan Cara Dagang OURA

Oura, perusahaan di balik Oura Ring, diperkirakan akan menetapkan harga penawaran umum perdana (IPO) di Amerika Serikat pada pekan tanggal 28 September 2026 dan mencatatkan sahamnya di Nasdaq Global S

Berita yang Sedang Tren

Lihat Selengkapnya
OJK Atur Kompetensi Finfluencer dan Tanggung Jawab Promosi Kripto

OJK Atur Kompetensi Finfluencer dan Tanggung Jawab Promosi Kripto

OJK menerbitkan POJK 6/2026 yang mengatur kompetensi finfluencer serta tanggung jawab perusahaan atas promosi aset kripto di Indonesia.

Indonesia Blokir Akses Polymarket setelah Diklasifikasikan sebagai Judi Online

Indonesia Blokir Akses Polymarket setelah Diklasifikasikan sebagai Judi Online

Indonesia memblokir akses ke Polymarket setelah Komdigi mengklasifikasikan kontrak prediksinya sebagai judi online dan menelusuri akun terkait.

Pendapatan DCI Indonesia Naik 33,2% pada Semester I 2026

Pendapatan DCI Indonesia Naik 33,2% pada Semester I 2026

Pendapatan DCI Indonesia naik 33,2% menjadi Rp1,77 triliun pada semester I 2026, dengan layanan kolokasi menyumbang 94,5% dari penjualan.

Pengawasan Kripto Indonesia Beralih ke OJK Setelah Penerapan Sistem CFX

Pengawasan Kripto Indonesia Beralih ke OJK Setelah Penerapan Sistem CFX

OJK mengambil alih pengawasan kripto Indonesia dari Bappebti pada Januari 2025, memperbarui kerangka perdagangan yang melibatkan sistem CFX.

Artikel Terkait

Lihat Selengkapnya
Bagaimana dengan: Kuasai Tren Pasar dengan Indikator Perdagangan Kripto: Panduan Lengkap

Bagaimana dengan: Kuasai Tren Pasar dengan Indikator Perdagangan Kripto: Panduan Lengkap

Dalam perdagangan kripto, analisis indikator teknis mengacu pada metode kuantitatif yang menggunakan rumus matematika dan statistik untuk menilai tren pasar. Dengan memproses data harga dan volume mel

Pesaing Oura: Samsung, Apple, dan Pasar Smart Ring

Pesaing Oura: Samsung, Apple, dan Pasar Smart Ring

Menurut prospektus IPO-nya, pesaing Oura terbagi dalam tiga kelompok: pembuat jam tangan pintar seperti Apple, Google, dan Samsung; perangkat wearable kebugaran seperti Garmin, Coros, dan Whoop; serta

Apakah Oura Menguntungkan? Pendapatan, Model Bisnis, dan Valuasi

Apakah Oura Menguntungkan? Pendapatan, Model Bisnis, dan Valuasi

Ya, Oura menguntungkan berdasarkan laba bersih. Prospektus IPO-nya menunjukkan laba bersih sebesar $60,8 juta dari pendapatan $1,21 miliar dalam sembilan bulan hingga 30 Juni 2026. Kerugian $924,3 jut

Review Bitget 2026: Skor 3,8 dari 5, Copy Trading Paling Lengkap, dan Tiga Tanggal Penting Keluarnya Bitget dari Jepang

Review Bitget 2026: Skor 3,8 dari 5, Copy Trading Paling Lengkap, dan Tiga Tanggal Penting Keluarnya Bitget dari Jepang

Per 25 September 2026, Bitget meraih skor 3,8 dari 5 pada penilaian enam dimensi kami: unggul di derivatif, mendapat skor sementara 3,5 untuk keamanan setelah insiden hot wallet senilai sekitar US$351


Daftar di MEXC
Daftar & Dapatkan Bonus hingga 10,000 USDT
Apa DNA Wall Street Anda?
Apa DNA Wall Street Anda?Apa DNA Wall Street Anda?
6 orang. Setiap orang dapat bagian dari $30K NVDAX.

Gabung ke Komunitas MEXC

Dapatkan listing, acara, dan perkembangan terbaru secara real time langsung dari saluran Telegram resmi kami.

25 rb+ anggota