Beli Kripto
Pasar
Spot
Futures OILBTC
Tabungan
Pusat Acara
Hub Hadiah
Lainnya
How to Use the Detrended Price Oscillator (DPO) in U.S. Stock Trading: A Complete Beginner's GuideHow to Use the Detrended Price Oscillator (DPO) in U.S. Stock Trading: A Complete Beginner's Guide
Daftar Kategori
Batalkan

How to Use the Detrended Price Oscillator (DPO) in U.S. Stock Trading: A Complete Beginner's Guide

Key Takeaways:

  • The Detrended Price Oscillator (DPO) is a technical indicator designed to remove longer-term trends and highlight shorter-term price cycles.
  • DPO is calculated using the difference between a historical closing price and a simple moving average.
  • DPO can help traders assess potential overbought and oversold levels, identify cycle highs and lows, and analyze potential entry and exit timing.
  • DPO is not a momentum indicator and should not be used on its own to assess trends. It is best used alongside other indicators.
  • Users can add DPO to MEXC's U.S. stock charts to support their analysis.

1. What Is the Detrended Price Oscillator?


The Detrended Price Oscillator (DPO), introduced by Walt Bressert, is an oscillator used in technical analysis. It aims to remove the influence of longer-term price trends so traders can identify shorter-term price cycles more clearly. A cycle is the time between successive peaks or successive troughs.

Unlike momentum indicators such as Moving Average Convergence Divergence (MACD), DPO does not measure how quickly prices change. Instead, it compares historical prices with a displaced simple moving average (SMA) to highlight historical price highs and lows. This makes it better suited to cycle analysis than real-time trend tracking.

2. How Is DPO Calculated?


The DPO formula is: DPO = Closing price from (X / 2 + 1) periods ago − Current X-period SMA

X is the user-defined lookback period. For a commonly used 20-day DPO:

1) Calculate the 20-day simple moving average.

2) Calculate the displacement: 20 / 2 + 1 = 11 periods.

3) Subtract the 20-day SMA value from the closing price 11 periods ago to obtain the DPO value.

The displacement aligns the moving average with an earlier price observation, helping filter out longer-term trends and highlight shorter-term cyclical fluctuations..
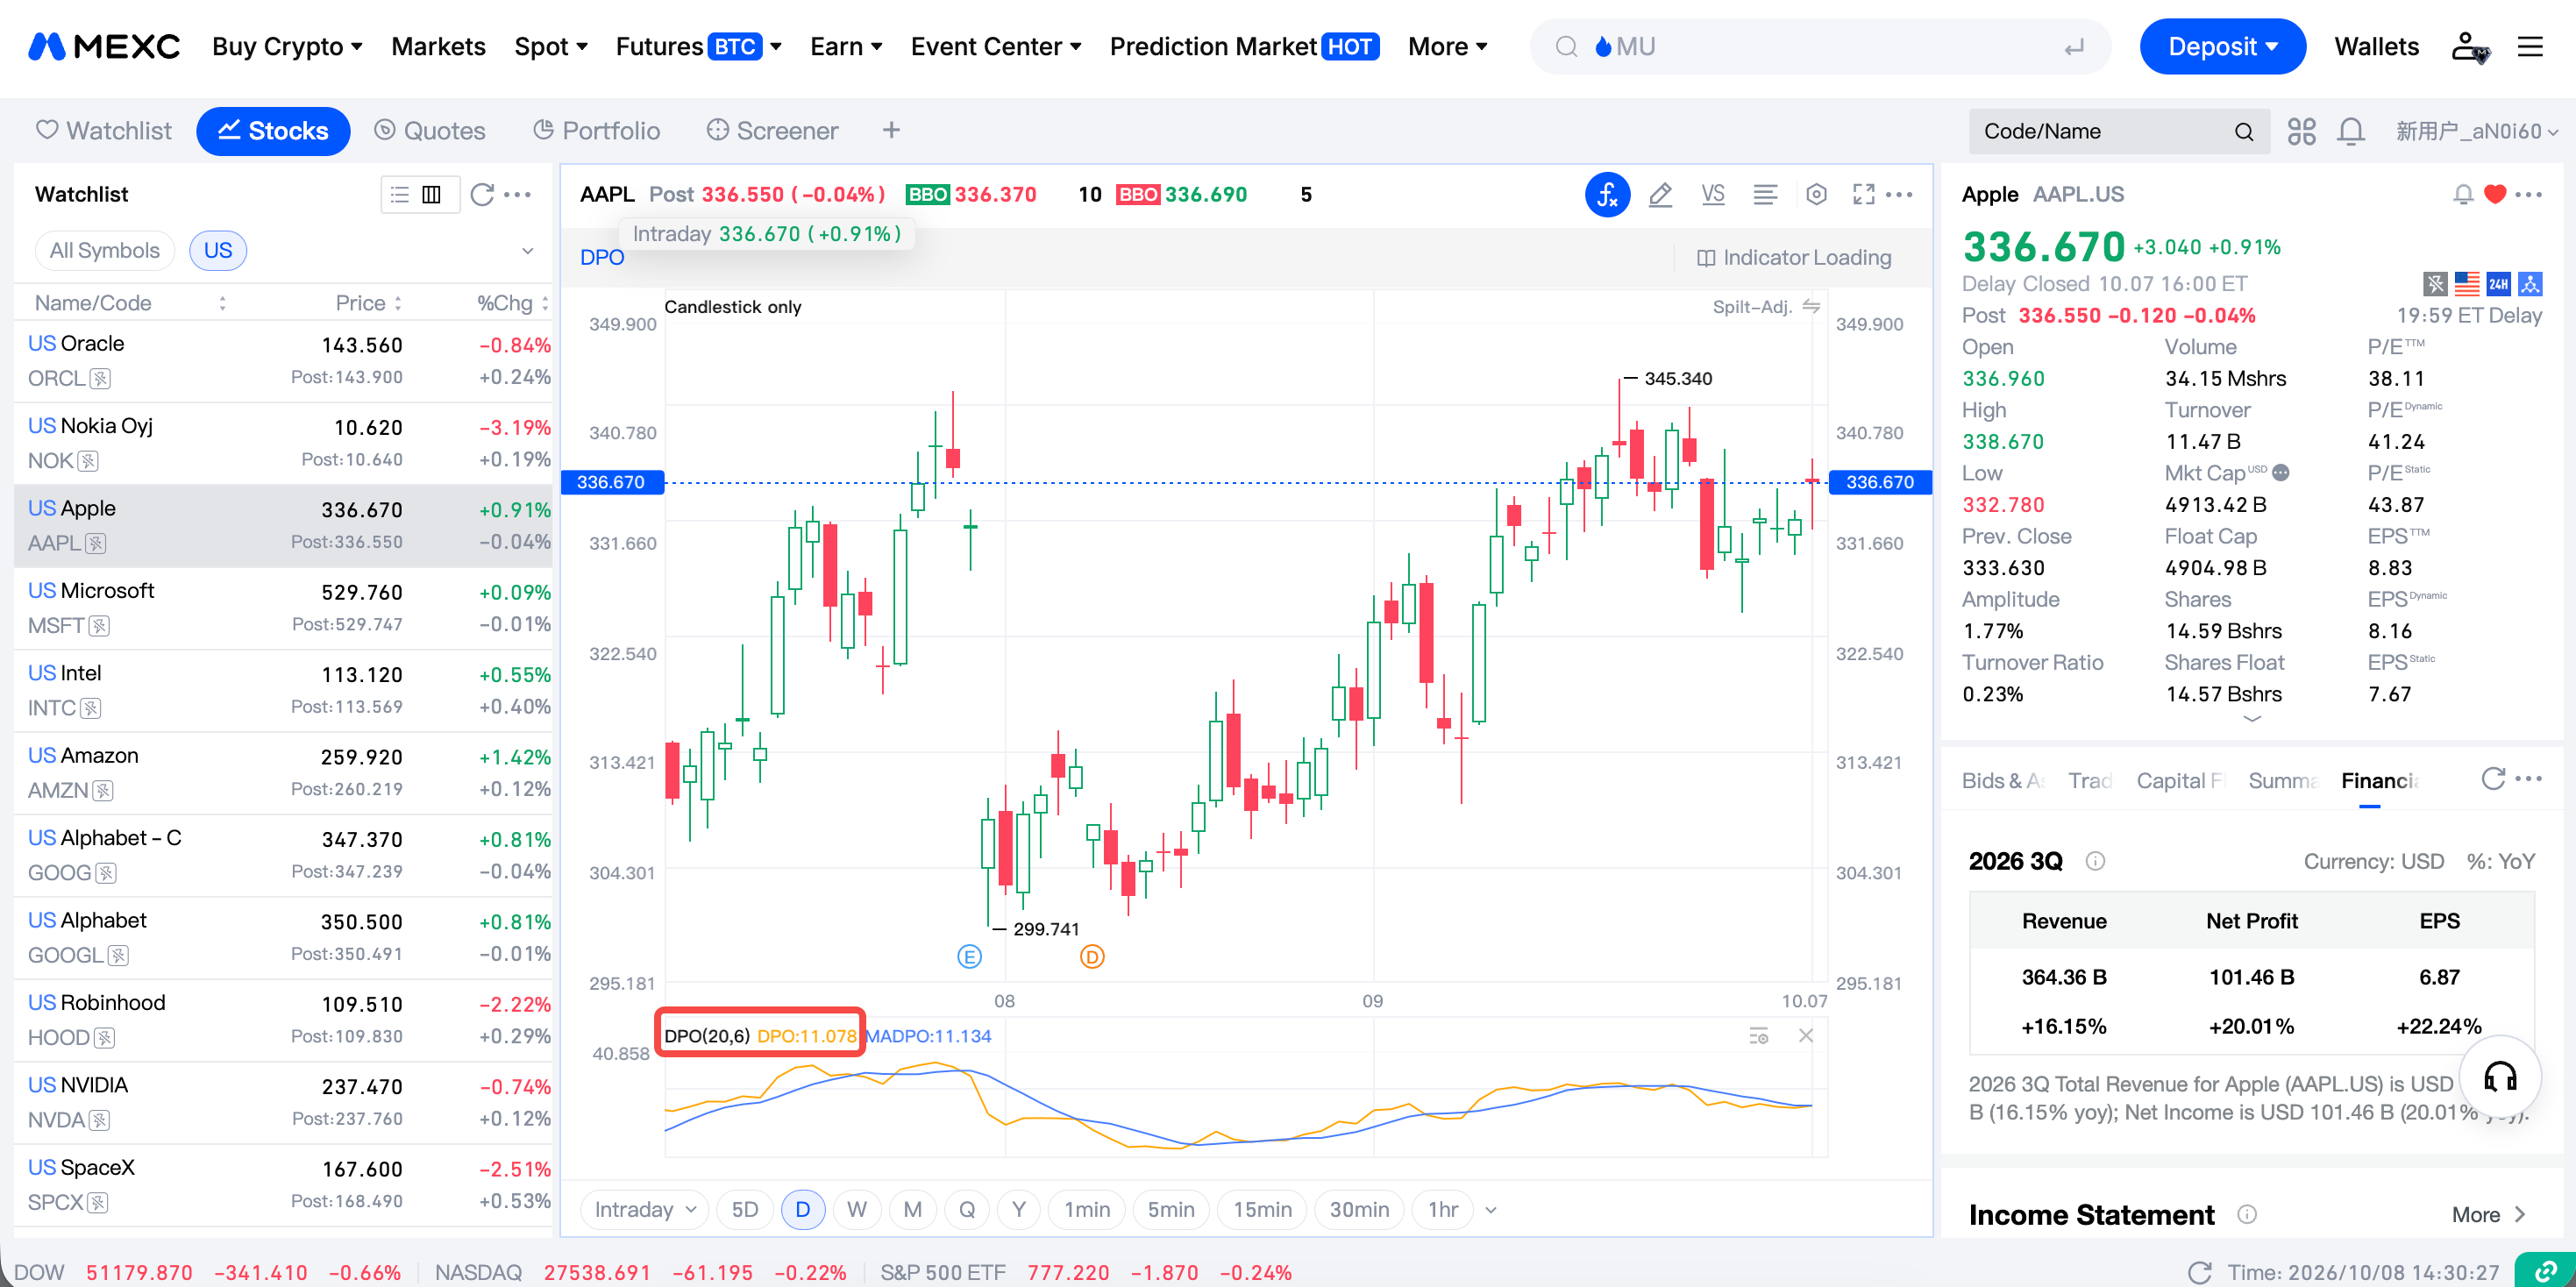

3. How to Use DPO


DPO fluctuates above and below zero. Common ways to interpret it include:

1) Interpreting positive and negative readings. A positive DPO value indicates that the historical closing price used in the calculation is above the SMA value used for comparison, which some traders interpret as a bullish indication for that historical period. A value below zero means it was below the average and may be interpreted as bearish. These readings do not establish the current trend.

2) Zero-line crossovers.
Some traders examine historical zero-line crossovers to identify changes in cyclical price behavior. However, because DPO is displaced into the past, these crossovers should not be treated as real-time buy or sell signals.

3) Overbought and oversold zones. Traders can set an upper reference level above zero to identify potential short-term cycle highs and a lower reference level below zero to identify potential cycle lows. Reaching either level may suggest relatively overbought or oversold conditions within the cycle, rather than confirm a price reversal.

4) Measuring cycles. By observing historical DPO peaks and troughs and measuring the time between successive peaks or successive troughs, traders can estimate a typical cycle length. For example, if troughs have occurred roughly two months apart, this may help identify when to watch for the next potential buying opportunity near a cycle low.

4. Suggested DPO Settings


A common default DPO lookback is 20 periods. Beginners can use the following approaches as a starting point:

  • Short-term trading: A shorter lookback, such as 14 periods, can help highlight shorter price cycles.
  • Medium-term analysis: The default 20-period setting can serve as a starting point for analyzing intermediate cycles.
  • Weekly charts: Consider a longer lookback and keep the timeframe units consistent.

5. Three Ways to Incorporate DPO into a Trading Strategy


Strategy 1: Combine zero-line crossovers with candlestick patterns. A historical DPO crossover above zero may be examined alongside bullish candlestick patterns from the corresponding period, such as bullish engulfing patterns or hammers. Conversely, a crossover below zero may be assessed alongside a bearish pattern when considering an exit. The historical alignment of DPO must be taken into account when comparing the signals.

Strategy 2: Use cycle highs and lows to assess timing. The cycle length estimated from DPO can help traders look for potential buying opportunities near cycle lows within an uptrend, or consider taking profits near cycle highs. The time between a peak and a trough can also provide a reference for a potential holding period.

Strategy 3: Use volume for confirmation. Trading volume reflects market activity. Traders can give more weight to DPO-related setups when supported by rising or elevated volume, and avoid relying on setups during low-volume periods to reduce the influence of market noise.

6. Limitations of DPO


DPO can be useful, but beginners should understand its limitations:

  • It should not be used alone: DPO is a supporting tool. Historical cycles may not repeat, and their duration can lengthen or shorten.
  • It does not establish trend direction: Even if price appears to be near a cycle low, buying during a sustained downtrend can still result in losses.
  • It is backward-looking: When displaced into the past, DPO does not reflect the latest price in real time and is not suitable for assessing the immediate trend.
  • Peaks and troughs vary in height: Not all peaks or troughs reach the same level. Important highs and lows should be assessed alongside price action.

Use DPO alongside trend and momentum indicators, and set stop-loss orders to help manage risk.

7. How to Use DPO on MEXC


MEXC's U.S. stock trading interface provides charting tools that allow users to add DPO to their analysis. Follow these steps:

1) Log in to your MEXC account and open the U.S. stock trading page.

2) Open the chart's Indicator Loading panel, then search for and add DPO.

3) Adjust the lookback period to suit your trading style. Assess the indicator alongside candlestick patterns, volume, and other tools before placing a buy or sell order.

Beginners are advised to first use MEXC's charting tools to observe and review historical setups. Once familiar with DPO's characteristics, they can gradually incorporate it into live trading while maintaining appropriate position sizing and risk controls.


8. DPO FAQ


8.1 What is the Detrended Price Oscillator?


DPO is an oscillator designed to remove longer-term price trends and focus on shorter-term price cycles. It compares historical closing prices with a displaced simple moving average to help identify cyclical highs and lows.

8.2 What is the DPO formula?


DPO = Closing price from (X / 2 + 1) periods ago − Current X-period SMA.

For a 20-period setting, subtract the 20-period SMA value from the closing price 11 periods ago.

8.3 How can DPO be used in trading?


Common approaches include examining historical zero-line crossovers as potential buying or selling indications, measuring cycle intervals to estimate potential future highs and lows, and assessing potential exits near overbought levels or entries near oversold levels. These are historical cycle references, not standalone real-time signals, and should be checked against other indicators.

8.4 What trading strategies use DPO?


Three common approaches combine zero-line crossovers with candlestick confirmation, use estimated cycle lengths to assess entry and exit timing, or use volume to filter setups. Regardless of the approach, use stop-loss orders and control position size.

8.5 What are the best DPO settings?


There is no universally best setting. A common default is 20 periods. Short-term traders may use a shorter lookback, while medium- to long-term analysis may use a longer one. Backtest settings to assess their suitability for your instrument, chart timeframe, and trading style.

8.6 Is DPO a momentum indicator?


No. In its centered form, DPO is displaced into the past and does not measure the latest price momentum. It is designed to identify price cycles rather than the speed of price increases or decreases.

8.7 Can DPO be used on its own to make buy or sell decisions?


It is not recommended. DPO is backward-looking and does not establish trend direction, so relying on it alone can lead to misinterpretation. Use it as a supporting tool alongside trend indicators, volume indicators, and price patterns.

8.8 Is DPO available on MEXC?


Yes. MEXC's U.S. stock charting tools support DPO and other technical indicators. Users can customize the parameters and combine the indicator with other analysis tools when developing a trading strategy.

How to Use the Detrended Price Oscillator (DPO) in U.S. Stock Trading: A Complete Beginner's Guide

Key Takeaways:

  • The Detrended Price Oscillator (DPO) is a technical indicator designed to remove longer-term trends and highlight shorter-term price cycles.
  • DPO is calculated using the difference between a historical closing price and a simple moving average.
  • DPO can help traders assess potential overbought and oversold levels, identify cycle highs and lows, and analyze potential entry and exit timing.
  • DPO is not a momentum indicator and should not be used on its own to assess trends. It is best used alongside other indicators.
  • Users can add DPO to MEXC's U.S. stock charts to support their analysis.

1. What Is the Detrended Price Oscillator?


The Detrended Price Oscillator (DPO), introduced by Walt Bressert, is an oscillator used in technical analysis. It aims to remove the influence of longer-term price trends so traders can identify shorter-term price cycles more clearly. A cycle is the time between successive peaks or successive troughs.

Unlike momentum indicators such as Moving Average Convergence Divergence (MACD), DPO does not measure how quickly prices change. Instead, it compares historical prices with a displaced simple moving average (SMA) to highlight historical price highs and lows. This makes it better suited to cycle analysis than real-time trend tracking.

2. How Is DPO Calculated?


The DPO formula is: DPO = Closing price from (X / 2 + 1) periods ago − Current X-period SMA

X is the user-defined lookback period. For a commonly used 20-day DPO:

1) Calculate the 20-day simple moving average.

2) Calculate the displacement: 20 / 2 + 1 = 11 periods.

3) Subtract the 20-day SMA value from the closing price 11 periods ago to obtain the DPO value.

The displacement aligns the moving average with an earlier price observation, helping filter out longer-term trends and highlight shorter-term cyclical fluctuations..


3. How to Use DPO


DPO fluctuates above and below zero. Common ways to interpret it include:

1) Interpreting positive and negative readings. A positive DPO value indicates that the historical closing price used in the calculation is above the SMA value used for comparison, which some traders interpret as a bullish indication for that historical period. A value below zero means it was below the average and may be interpreted as bearish. These readings do not establish the current trend.

2) Zero-line crossovers.
Some traders examine historical zero-line crossovers to identify changes in cyclical price behavior. However, because DPO is displaced into the past, these crossovers should not be treated as real-time buy or sell signals.

3) Overbought and oversold zones. Traders can set an upper reference level above zero to identify potential short-term cycle highs and a lower reference level below zero to identify potential cycle lows. Reaching either level may suggest relatively overbought or oversold conditions within the cycle, rather than confirm a price reversal.

4) Measuring cycles. By observing historical DPO peaks and troughs and measuring the time between successive peaks or successive troughs, traders can estimate a typical cycle length. For example, if troughs have occurred roughly two months apart, this may help identify when to watch for the next potential buying opportunity near a cycle low.

4. Suggested DPO Settings


A common default DPO lookback is 20 periods. Beginners can use the following approaches as a starting point:

  • Short-term trading: A shorter lookback, such as 14 periods, can help highlight shorter price cycles.
  • Medium-term analysis: The default 20-period setting can serve as a starting point for analyzing intermediate cycles.
  • Weekly charts: Consider a longer lookback and keep the timeframe units consistent.

5. Three Ways to Incorporate DPO into a Trading Strategy


Strategy 1: Combine zero-line crossovers with candlestick patterns. A historical DPO crossover above zero may be examined alongside bullish candlestick patterns from the corresponding period, such as bullish engulfing patterns or hammers. Conversely, a crossover below zero may be assessed alongside a bearish pattern when considering an exit. The historical alignment of DPO must be taken into account when comparing the signals.

Strategy 2: Use cycle highs and lows to assess timing. The cycle length estimated from DPO can help traders look for potential buying opportunities near cycle lows within an uptrend, or consider taking profits near cycle highs. The time between a peak and a trough can also provide a reference for a potential holding period.

Strategy 3: Use volume for confirmation. Trading volume reflects market activity. Traders can give more weight to DPO-related setups when supported by rising or elevated volume, and avoid relying on setups during low-volume periods to reduce the influence of market noise.

6. Limitations of DPO


DPO can be useful, but beginners should understand its limitations:

  • It should not be used alone: DPO is a supporting tool. Historical cycles may not repeat, and their duration can lengthen or shorten.
  • It does not establish trend direction: Even if price appears to be near a cycle low, buying during a sustained downtrend can still result in losses.
  • It is backward-looking: When displaced into the past, DPO does not reflect the latest price in real time and is not suitable for assessing the immediate trend.
  • Peaks and troughs vary in height: Not all peaks or troughs reach the same level. Important highs and lows should be assessed alongside price action.

Use DPO alongside trend and momentum indicators, and set stop-loss orders to help manage risk.

7. How to Use DPO on MEXC


MEXC's U.S. stock trading interface provides charting tools that allow users to add DPO to their analysis. Follow these steps:

1) Log in to your MEXC account and open the U.S. stock trading page.

2) Open the chart's Indicator Loading panel, then search for and add DPO.

3) Adjust the lookback period to suit your trading style. Assess the indicator alongside candlestick patterns, volume, and other tools before placing a buy or sell order.

Beginners are advised to first use MEXC's charting tools to observe and review historical setups. Once familiar with DPO's characteristics, they can gradually incorporate it into live trading while maintaining appropriate position sizing and risk controls.


8. DPO FAQ


8.1 What is the Detrended Price Oscillator?


DPO is an oscillator designed to remove longer-term price trends and focus on shorter-term price cycles. It compares historical closing prices with a displaced simple moving average to help identify cyclical highs and lows.

8.2 What is the DPO formula?


DPO = Closing price from (X / 2 + 1) periods ago − Current X-period SMA.

For a 20-period setting, subtract the 20-period SMA value from the closing price 11 periods ago.

8.3 How can DPO be used in trading?


Common approaches include examining historical zero-line crossovers as potential buying or selling indications, measuring cycle intervals to estimate potential future highs and lows, and assessing potential exits near overbought levels or entries near oversold levels. These are historical cycle references, not standalone real-time signals, and should be checked against other indicators.

8.4 What trading strategies use DPO?


Three common approaches combine zero-line crossovers with candlestick confirmation, use estimated cycle lengths to assess entry and exit timing, or use volume to filter setups. Regardless of the approach, use stop-loss orders and control position size.

8.5 What are the best DPO settings?


There is no universally best setting. A common default is 20 periods. Short-term traders may use a shorter lookback, while medium- to long-term analysis may use a longer one. Backtest settings to assess their suitability for your instrument, chart timeframe, and trading style.

8.6 Is DPO a momentum indicator?


No. In its centered form, DPO is displaced into the past and does not measure the latest price momentum. It is designed to identify price cycles rather than the speed of price increases or decreases.

8.7 Can DPO be used on its own to make buy or sell decisions?


It is not recommended. DPO is backward-looking and does not establish trend direction, so relying on it alone can lead to misinterpretation. Use it as a supporting tool alongside trend indicators, volume indicators, and price patterns.

8.8 Is DPO available on MEXC?


Yes. MEXC's U.S. stock charting tools support DPO and other technical indicators. Users can customize the parameters and combine the indicator with other analysis tools when developing a trading strategy.