Beli Kripto
Pasar
Spot
Futures OILBTC
Tabungan
Pusat Acara
Hub Hadiah
Lainnya
PoR 100%+
How to Use the Oscillator (OSC) in U.S. Stock Trading: A Complete Beginner's GuideHow to Use the Oscillator (OSC) in U.S. Stock Trading: A Complete Beginner's Guide
Daftar Kategori
Batalkan

How to Use the Oscillator (OSC) in U.S. Stock Trading: A Complete Beginner's Guide

Key Takeaways:

  • The Oscillator (OSC) is a momentum-based technical analysis tool that measures the speed of price changes and helps identify overbought and oversold conditions.
  • The OSC uses a centerline to distinguish bullish from bearish conditions: readings above the centerline indicate bullish conditions, while readings below it indicate bearish conditions.
  • Divergence is one of the most useful oscillator signals and can provide an early warning of a potential trend reversal.
  • Oscillators are suited to range-bound markets, while trend indicators are suited to directional markets. Combining the two can improve analysis.
  • MEXC supports the OSC for U.S. stock trading, allowing users to apply the strategies in this guide directly through its charting tools.

1. What Is an Oscillator?


Oscillators are among the most widely used tools in technical analysis. They measure the speed and magnitude of changes in an asset's price, which is why they are also known as momentum indicators. An oscillator typically consists of upper and lower boundaries and an indicator line that fluctuates between them. Traders assess the line's position to determine whether the market is overbought or oversold.

The Oscillator (OSC) is calculated as the ratio of the current day's closing price to the average closing price over a specified number of preceding trading days, typically expressed as a percentage. The OSC has a centerline of 100. A reading above 100 means the price is above its recent average, indicating bullish conditions. A reading below 100 means the price is below its recent average, indicating bearish conditions.

When trading U.S. stocks on MEXC, you can add the OSC directly to the price chart and combine it with other analysis tools to develop a trading strategy.
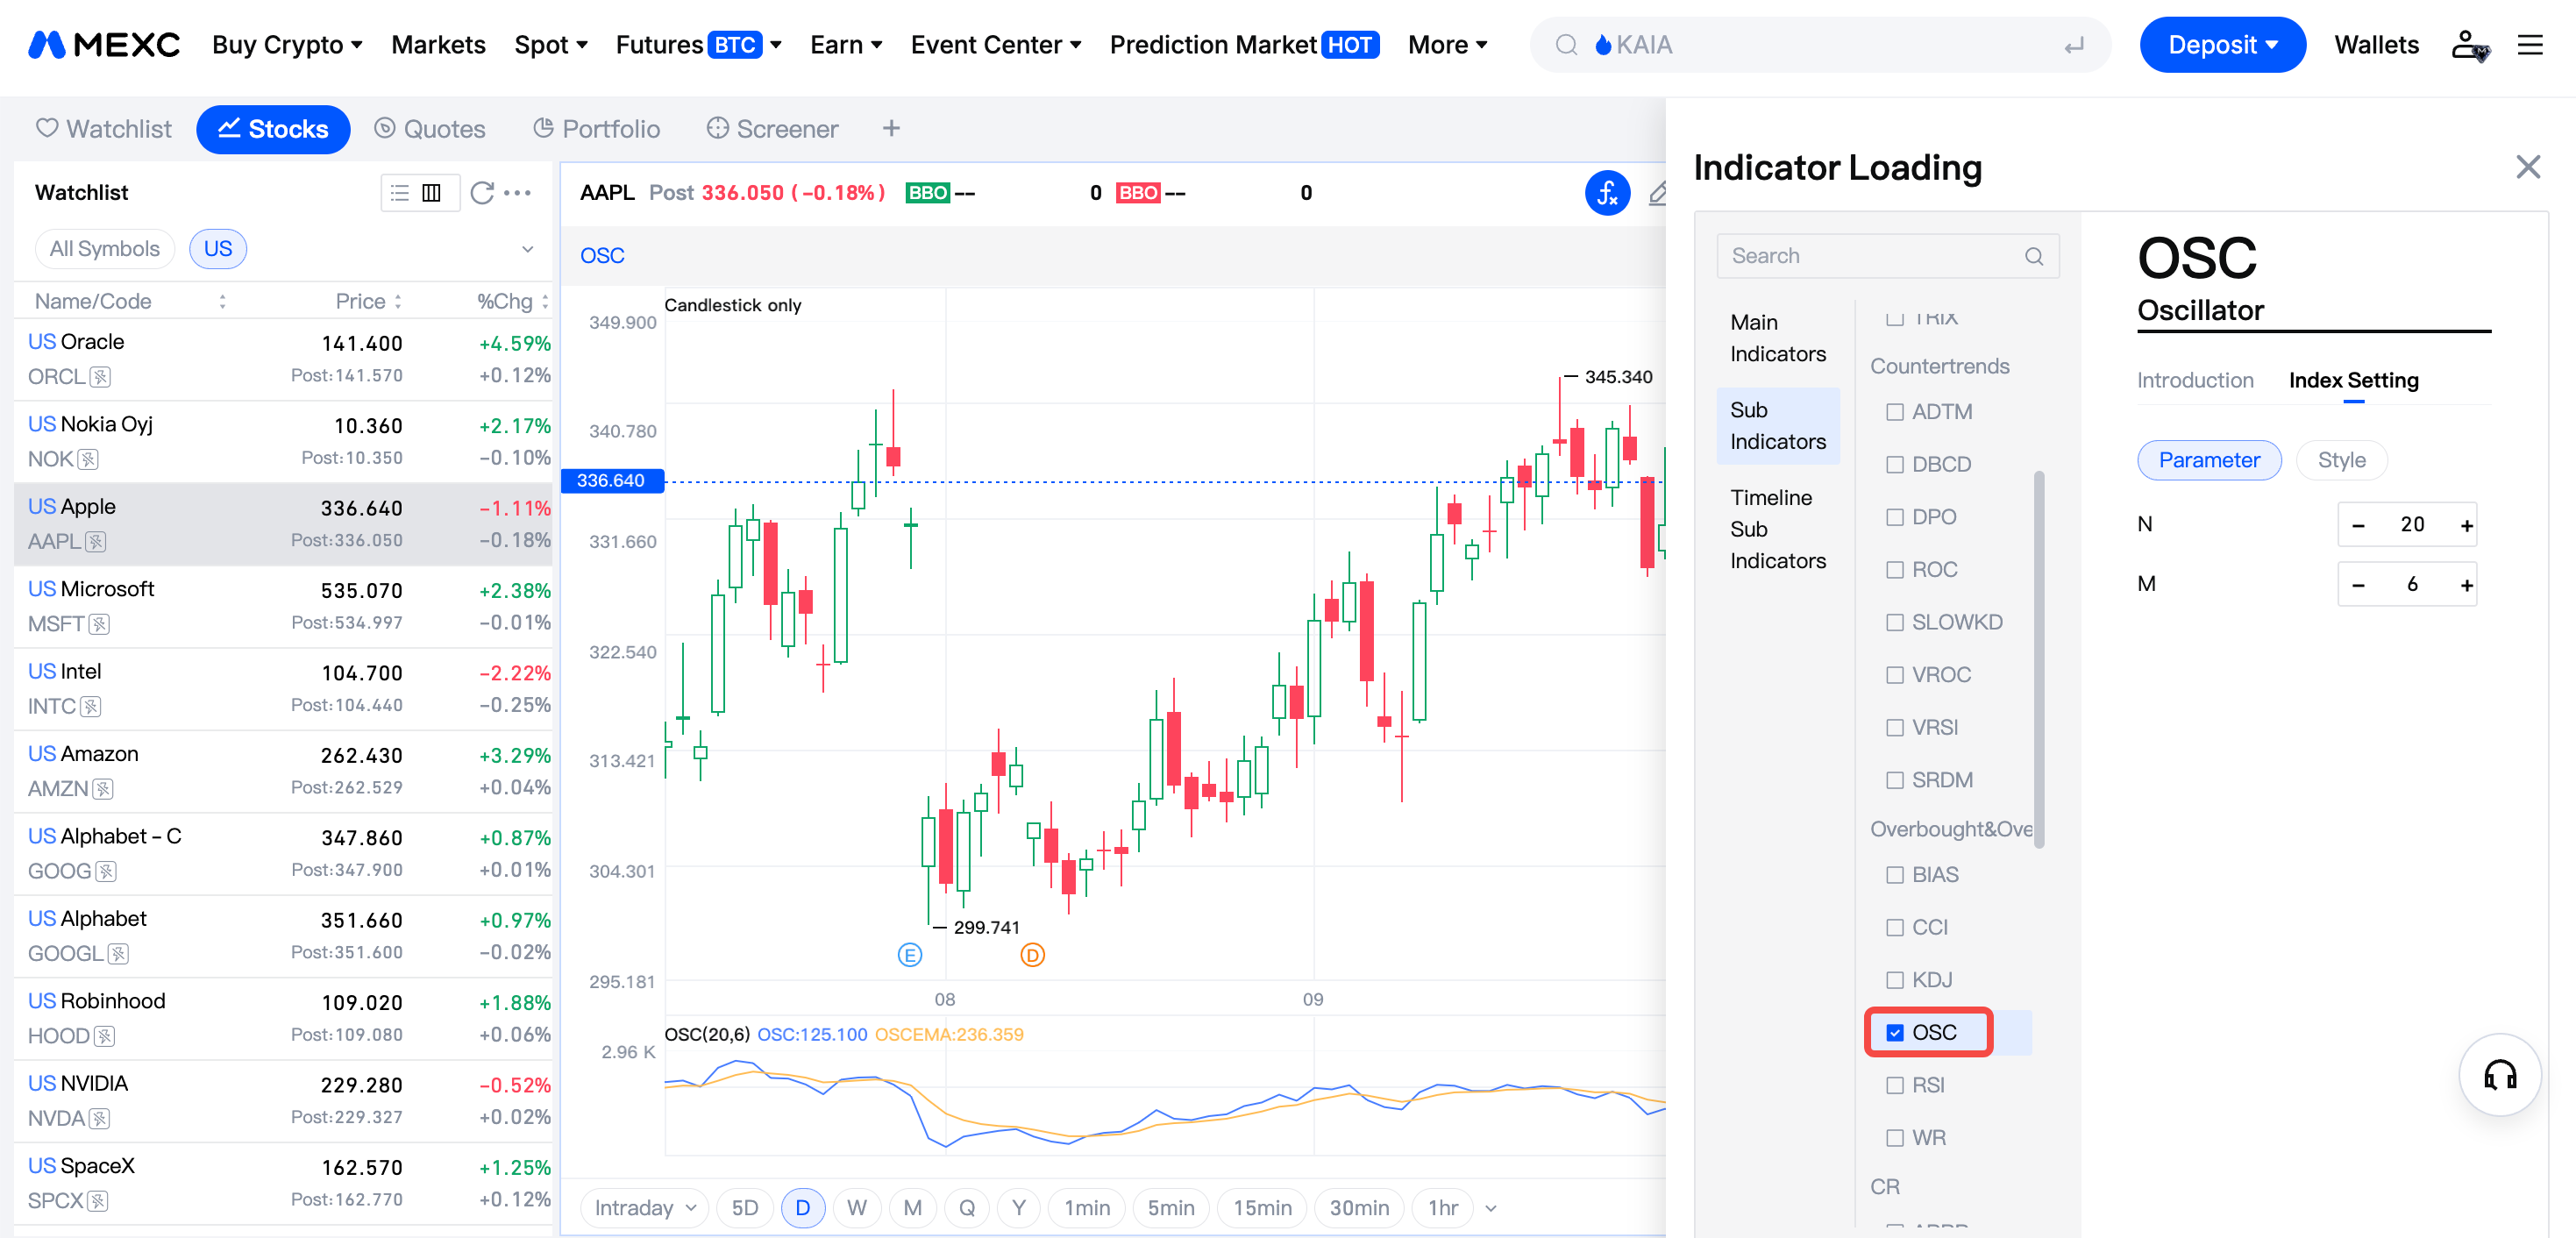


2. How Oscillators Work


Oscillators apply mathematical formulas to price data to generate a series of values that fluctuate within a fixed or relatively fixed range. Structurally, they fall into two main categories:

Centered oscillators: These fluctuate above and below a centerline. For example, the OSC fluctuates around 100, while the Moving Average Convergence Divergence (MACD) fluctuates around zero. These indicators help assess the direction and strength of momentum. Readings above the centerline indicate that bullish momentum is dominant, while readings below it indicate that bearish momentum is dominant.

Banded oscillators: These fluctuate between defined upper and lower boundaries. For example, the Relative Strength Index (RSI) ranges from 0 to 100, with 70 typically marking the overbought threshold and 30 marking the oversold threshold. These indicators help identify extreme price conditions.

The OSC's overbought and oversold thresholds can vary depending on the characteristics of each stock. Use historical data to adjust the parameters rather than applying fixed values mechanically.

3. Common Oscillators


In addition to the OSC, the following widely used oscillators are common in U.S. stock trading and are all supported by MEXC's charting tools:

Relative Strength Index (RSI): Compares average gains with average losses over a given period to assess the balance between buying and selling pressure. Readings above 70 indicate overbought conditions, while readings below 30 indicate oversold conditions. It is best suited to range-bound markets.

Moving Average Convergence Divergence (MACD): Based on the difference between a fast and a slow exponential moving average, the MACD combines trend-following and momentum analysis. It helps identify trend changes and potential entry and exit points.

Stochastic Oscillator (KDJ): Generates signals by comparing the latest closing price with the highest and lowest prices over the past 14 trading days. Readings above 80 indicate overbought conditions, while readings below 20 indicate oversold conditions. It is particularly sensitive to short-term reversals.

4. How to Use the OSC


4.1 Use centerline crossovers to identify bullish and bearish momentum


When the OSC crosses above the 100 centerline, it indicates a shift from bearish to bullish momentum and may be interpreted as a buy signal. When it crosses below the centerline, it indicates a shift from bullish to bearish momentum and may be interpreted as a sell signal.

A crossover above the OSC's own moving average may also present a potential buying opportunity, while a crossover below it may present a potential selling opportunity. Centerline crossovers are straightforward to interpret, but they can be affected by considerable market noise in sideways markets. Use other tools to confirm these signals.


4.2 Identify overbought and oversold zones


When the OSC reaches the upper end of its historical range, it suggests that short-term gains may be overextended and a pullback could follow. When it reaches the lower end of its historical range, it suggests that short-term losses may be excessive and a rebound could occur.

For beginners, it is important to remember that overbought does not mean sell immediately, and oversold does not mean buy immediately. During a strong directional trend, the indicator can remain at extreme levels for an extended period. In these conditions, focus on trading with the trend: look for potential buying opportunities from oversold signals in an uptrend and potential selling opportunities from overbought signals in a downtrend.

4.3 Use divergence to anticipate potential reversals


Bullish divergence occurs when the stock price makes a lower low while the OSC makes a higher low. This suggests that downward momentum is weakening and the trend may reverse from downward to upward.

Bearish divergence occurs when the stock price makes a higher high while the OSC makes a lower high. This suggests that upward momentum is weakening and the trend may reverse from upward to downward.

When the OSC diverges from the stock price at high or low levels, stay alert to the possibility of a price reversal.

5. Combining Indicators for U.S. Stock Trading on MEXC


No single indicator is immune to misinterpretation. Beginners trading U.S. stocks on MEXC should use multiple tools to confirm signals:

1) Use moving averages to confirm the broader trend, the OSC or RSI to identify potential entry and exit points, and Bollinger Bands to assess volatility.

2) A buy signal has the strongest confirmation when an oversold reading, bullish divergence, and a moving average golden cross occur together.

3) No indicator can guarantee 100% accuracy. Disciplined position sizing and stop-loss management remain essential to trading.

6. Oscillators vs. Moving Averages


Oscillators and moving averages serve complementary purposes. Moving averages are lagging, trend-following indicators that help confirm the direction of a trend and support holding positions while that trend continues, but their signals often lag behind price movements. Oscillators are leading indicators that can provide early indications of potential entry and exit opportunities, although they are more susceptible to market noise in trending markets.

In short, oscillators are suited to range-bound markets, while moving averages are suited to directional markets. Combining the two can strengthen trading analysis. For example, when the OSC generates a buy signal while the stock price is above its 50-day moving average, the bullish signal has stronger confirmation.

7. Oscillator FAQs


7.1 What is an oscillator in trading?


An oscillator is a technical analysis tool that measures the speed of changes in an asset's price. Its values fluctuate within a fixed range or around a centerline to help identify overbought and oversold conditions, momentum strength, and potential trend reversal points.

7.2 How do you use oscillators in trading?


There are three main approaches: use centerline crossovers to assess bullish or bearish momentum, identify overbought and oversold zones to look for potential reversals, and examine divergence between price and the indicator to anticipate possible trend changes. Use trend indicators alongside oscillators to confirm signals.

7.3 Which oscillator is best for trading?


No single indicator is best in every situation. The RSI is suited to identifying overbought and oversold conditions, the MACD to spotting trend changes, and the stochastic oscillator to short-term trading. Beginners should focus on mastering two or three complementary indicators rather than trying to use too many.

7.4 What are oscillators mainly used for?


Oscillators help identify overbought and oversold conditions, assess the direction and strength of momentum, flag potential trend reversals through divergence, and confirm signals from other technical analysis tools.

7.5 What is the 3-5-7 rule in trading?


The 3-5-7 rule is a risk management principle that limits risk on a single trade to 3% of account funds, total risk exposure in a single market to 5%, and overall account risk to 7%. Used alongside oscillators, it can help manage trading risk.

7.6 Can I use the OSC to analyze U.S. stocks on MEXC?


Yes. MEXC supports the OSC and a range of other popular technical indicators for U.S. stock trading. You can add them through the charting tools and customize their parameters to suit individual stocks.

How to Use the Oscillator (OSC) in U.S. Stock Trading: A Complete Beginner's Guide

Key Takeaways:

  • The Oscillator (OSC) is a momentum-based technical analysis tool that measures the speed of price changes and helps identify overbought and oversold conditions.
  • The OSC uses a centerline to distinguish bullish from bearish conditions: readings above the centerline indicate bullish conditions, while readings below it indicate bearish conditions.
  • Divergence is one of the most useful oscillator signals and can provide an early warning of a potential trend reversal.
  • Oscillators are suited to range-bound markets, while trend indicators are suited to directional markets. Combining the two can improve analysis.
  • MEXC supports the OSC for U.S. stock trading, allowing users to apply the strategies in this guide directly through its charting tools.

1. What Is an Oscillator?


Oscillators are among the most widely used tools in technical analysis. They measure the speed and magnitude of changes in an asset's price, which is why they are also known as momentum indicators. An oscillator typically consists of upper and lower boundaries and an indicator line that fluctuates between them. Traders assess the line's position to determine whether the market is overbought or oversold.

The Oscillator (OSC) is calculated as the ratio of the current day's closing price to the average closing price over a specified number of preceding trading days, typically expressed as a percentage. The OSC has a centerline of 100. A reading above 100 means the price is above its recent average, indicating bullish conditions. A reading below 100 means the price is below its recent average, indicating bearish conditions.

When trading U.S. stocks on MEXC, you can add the OSC directly to the price chart and combine it with other analysis tools to develop a trading strategy.


2. How Oscillators Work


Oscillators apply mathematical formulas to price data to generate a series of values that fluctuate within a fixed or relatively fixed range. Structurally, they fall into two main categories:

Centered oscillators: These fluctuate above and below a centerline. For example, the OSC fluctuates around 100, while the Moving Average Convergence Divergence (MACD) fluctuates around zero. These indicators help assess the direction and strength of momentum. Readings above the centerline indicate that bullish momentum is dominant, while readings below it indicate that bearish momentum is dominant.

Banded oscillators: These fluctuate between defined upper and lower boundaries. For example, the Relative Strength Index (RSI) ranges from 0 to 100, with 70 typically marking the overbought threshold and 30 marking the oversold threshold. These indicators help identify extreme price conditions.

The OSC's overbought and oversold thresholds can vary depending on the characteristics of each stock. Use historical data to adjust the parameters rather than applying fixed values mechanically.

3. Common Oscillators


In addition to the OSC, the following widely used oscillators are common in U.S. stock trading and are all supported by MEXC's charting tools:

Relative Strength Index (RSI): Compares average gains with average losses over a given period to assess the balance between buying and selling pressure. Readings above 70 indicate overbought conditions, while readings below 30 indicate oversold conditions. It is best suited to range-bound markets.

Moving Average Convergence Divergence (MACD): Based on the difference between a fast and a slow exponential moving average, the MACD combines trend-following and momentum analysis. It helps identify trend changes and potential entry and exit points.

Stochastic Oscillator (KDJ): Generates signals by comparing the latest closing price with the highest and lowest prices over the past 14 trading days. Readings above 80 indicate overbought conditions, while readings below 20 indicate oversold conditions. It is particularly sensitive to short-term reversals.

4. How to Use the OSC


4.1 Use centerline crossovers to identify bullish and bearish momentum


When the OSC crosses above the 100 centerline, it indicates a shift from bearish to bullish momentum and may be interpreted as a buy signal. When it crosses below the centerline, it indicates a shift from bullish to bearish momentum and may be interpreted as a sell signal.

A crossover above the OSC's own moving average may also present a potential buying opportunity, while a crossover below it may present a potential selling opportunity. Centerline crossovers are straightforward to interpret, but they can be affected by considerable market noise in sideways markets. Use other tools to confirm these signals.


4.2 Identify overbought and oversold zones


When the OSC reaches the upper end of its historical range, it suggests that short-term gains may be overextended and a pullback could follow. When it reaches the lower end of its historical range, it suggests that short-term losses may be excessive and a rebound could occur.

For beginners, it is important to remember that overbought does not mean sell immediately, and oversold does not mean buy immediately. During a strong directional trend, the indicator can remain at extreme levels for an extended period. In these conditions, focus on trading with the trend: look for potential buying opportunities from oversold signals in an uptrend and potential selling opportunities from overbought signals in a downtrend.

4.3 Use divergence to anticipate potential reversals


Bullish divergence occurs when the stock price makes a lower low while the OSC makes a higher low. This suggests that downward momentum is weakening and the trend may reverse from downward to upward.

Bearish divergence occurs when the stock price makes a higher high while the OSC makes a lower high. This suggests that upward momentum is weakening and the trend may reverse from upward to downward.

When the OSC diverges from the stock price at high or low levels, stay alert to the possibility of a price reversal.

5. Combining Indicators for U.S. Stock Trading on MEXC


No single indicator is immune to misinterpretation. Beginners trading U.S. stocks on MEXC should use multiple tools to confirm signals:

1) Use moving averages to confirm the broader trend, the OSC or RSI to identify potential entry and exit points, and Bollinger Bands to assess volatility.

2) A buy signal has the strongest confirmation when an oversold reading, bullish divergence, and a moving average golden cross occur together.

3) No indicator can guarantee 100% accuracy. Disciplined position sizing and stop-loss management remain essential to trading.

6. Oscillators vs. Moving Averages


Oscillators and moving averages serve complementary purposes. Moving averages are lagging, trend-following indicators that help confirm the direction of a trend and support holding positions while that trend continues, but their signals often lag behind price movements. Oscillators are leading indicators that can provide early indications of potential entry and exit opportunities, although they are more susceptible to market noise in trending markets.

In short, oscillators are suited to range-bound markets, while moving averages are suited to directional markets. Combining the two can strengthen trading analysis. For example, when the OSC generates a buy signal while the stock price is above its 50-day moving average, the bullish signal has stronger confirmation.

7. Oscillator FAQs


7.1 What is an oscillator in trading?


An oscillator is a technical analysis tool that measures the speed of changes in an asset's price. Its values fluctuate within a fixed range or around a centerline to help identify overbought and oversold conditions, momentum strength, and potential trend reversal points.

7.2 How do you use oscillators in trading?


There are three main approaches: use centerline crossovers to assess bullish or bearish momentum, identify overbought and oversold zones to look for potential reversals, and examine divergence between price and the indicator to anticipate possible trend changes. Use trend indicators alongside oscillators to confirm signals.

7.3 Which oscillator is best for trading?


No single indicator is best in every situation. The RSI is suited to identifying overbought and oversold conditions, the MACD to spotting trend changes, and the stochastic oscillator to short-term trading. Beginners should focus on mastering two or three complementary indicators rather than trying to use too many.

7.4 What are oscillators mainly used for?


Oscillators help identify overbought and oversold conditions, assess the direction and strength of momentum, flag potential trend reversals through divergence, and confirm signals from other technical analysis tools.

7.5 What is the 3-5-7 rule in trading?


The 3-5-7 rule is a risk management principle that limits risk on a single trade to 3% of account funds, total risk exposure in a single market to 5%, and overall account risk to 7%. Used alongside oscillators, it can help manage trading risk.

7.6 Can I use the OSC to analyze U.S. stocks on MEXC?


Yes. MEXC supports the OSC and a range of other popular technical indicators for U.S. stock trading. You can add them through the charting tools and customize their parameters to suit individual stocks.