Beli Kripto
Pasar
Spot
Futures OILBTC
Tabungan
Pusat Acara
Hub Hadiah
Lainnya
How to Use the Slow Stochastic Oscillator (SLOWKD) in U.S. Stock Trading: A Complete Beginner's GuideHow to Use the Slow Stochastic Oscillator (SLOWKD) in U.S. Stock Trading: A Complete Beginner's Guide
Daftar Kategori
Batalkan

How to Use the Slow Stochastic Oscillator (SLOWKD) in U.S. Stock Trading: A Complete Beginner's Guide

Key Takeaways:

  • The slow stochastic oscillator is a momentum indicator that fluctuates between 0 and 100.
  • It smooths short-term price fluctuations, producing a steadier line than the fast version and helping filter market noise.
  • A common parameter setting is (14, 3, 3). Readings above 80 indicate overbought conditions, while readings below 20 indicate oversold conditions.
  • Crossovers between the K and D lines and divergence patterns are key tools for identifying potential buy and sell signals.
  • The same analytical principles can also be applied to cryptocurrency trading on MEXC.

1. What Is the Slow Stochastic Oscillator?


The slow stochastic oscillator (SLOWKD) is a smoothed version of the momentum indicator developed by George Lane in the late 1950s. It measures where the closing price sits within the high-low range over a given period. Traders use it to identify potential trend reversals.

The slow stochastic oscillator builds on the original stochastic oscillator, also known as the fast stochastic oscillator. It applies a moving average to the K value to smooth short-term price fluctuations and help filter market noise when assessing potential entries and exits. Its values remain between 0 and 100, making it useful for identifying overbought and oversold conditions.

2. Slow Stochastic Oscillator Settings


A common parameter combination for the slow stochastic oscillator is (14, 3, 3). The first number, 14, represents the lookback period, which can be measured in days, weeks, or intraday intervals. The second number, 3, is the moving average period used to smooth the K value. The third number, 3, is the moving average period used to calculate the D value.

Settings can be adjusted to suit different trading styles. A shorter lookback period, such as 5 or 10, makes the indicator more sensitive, generating more signals but also more market noise. This may suit short-term traders. A longer lookback period, such as 20, produces a smoother indicator with fewer signals and may suit swing traders. Some short-term traders use (5, 3, 3) for greater sensitivity. On MEXC, users can customize the SLOWKD parameters available in the U.S. stock chart's "Index Loading" panel to suit different instruments' volatility.
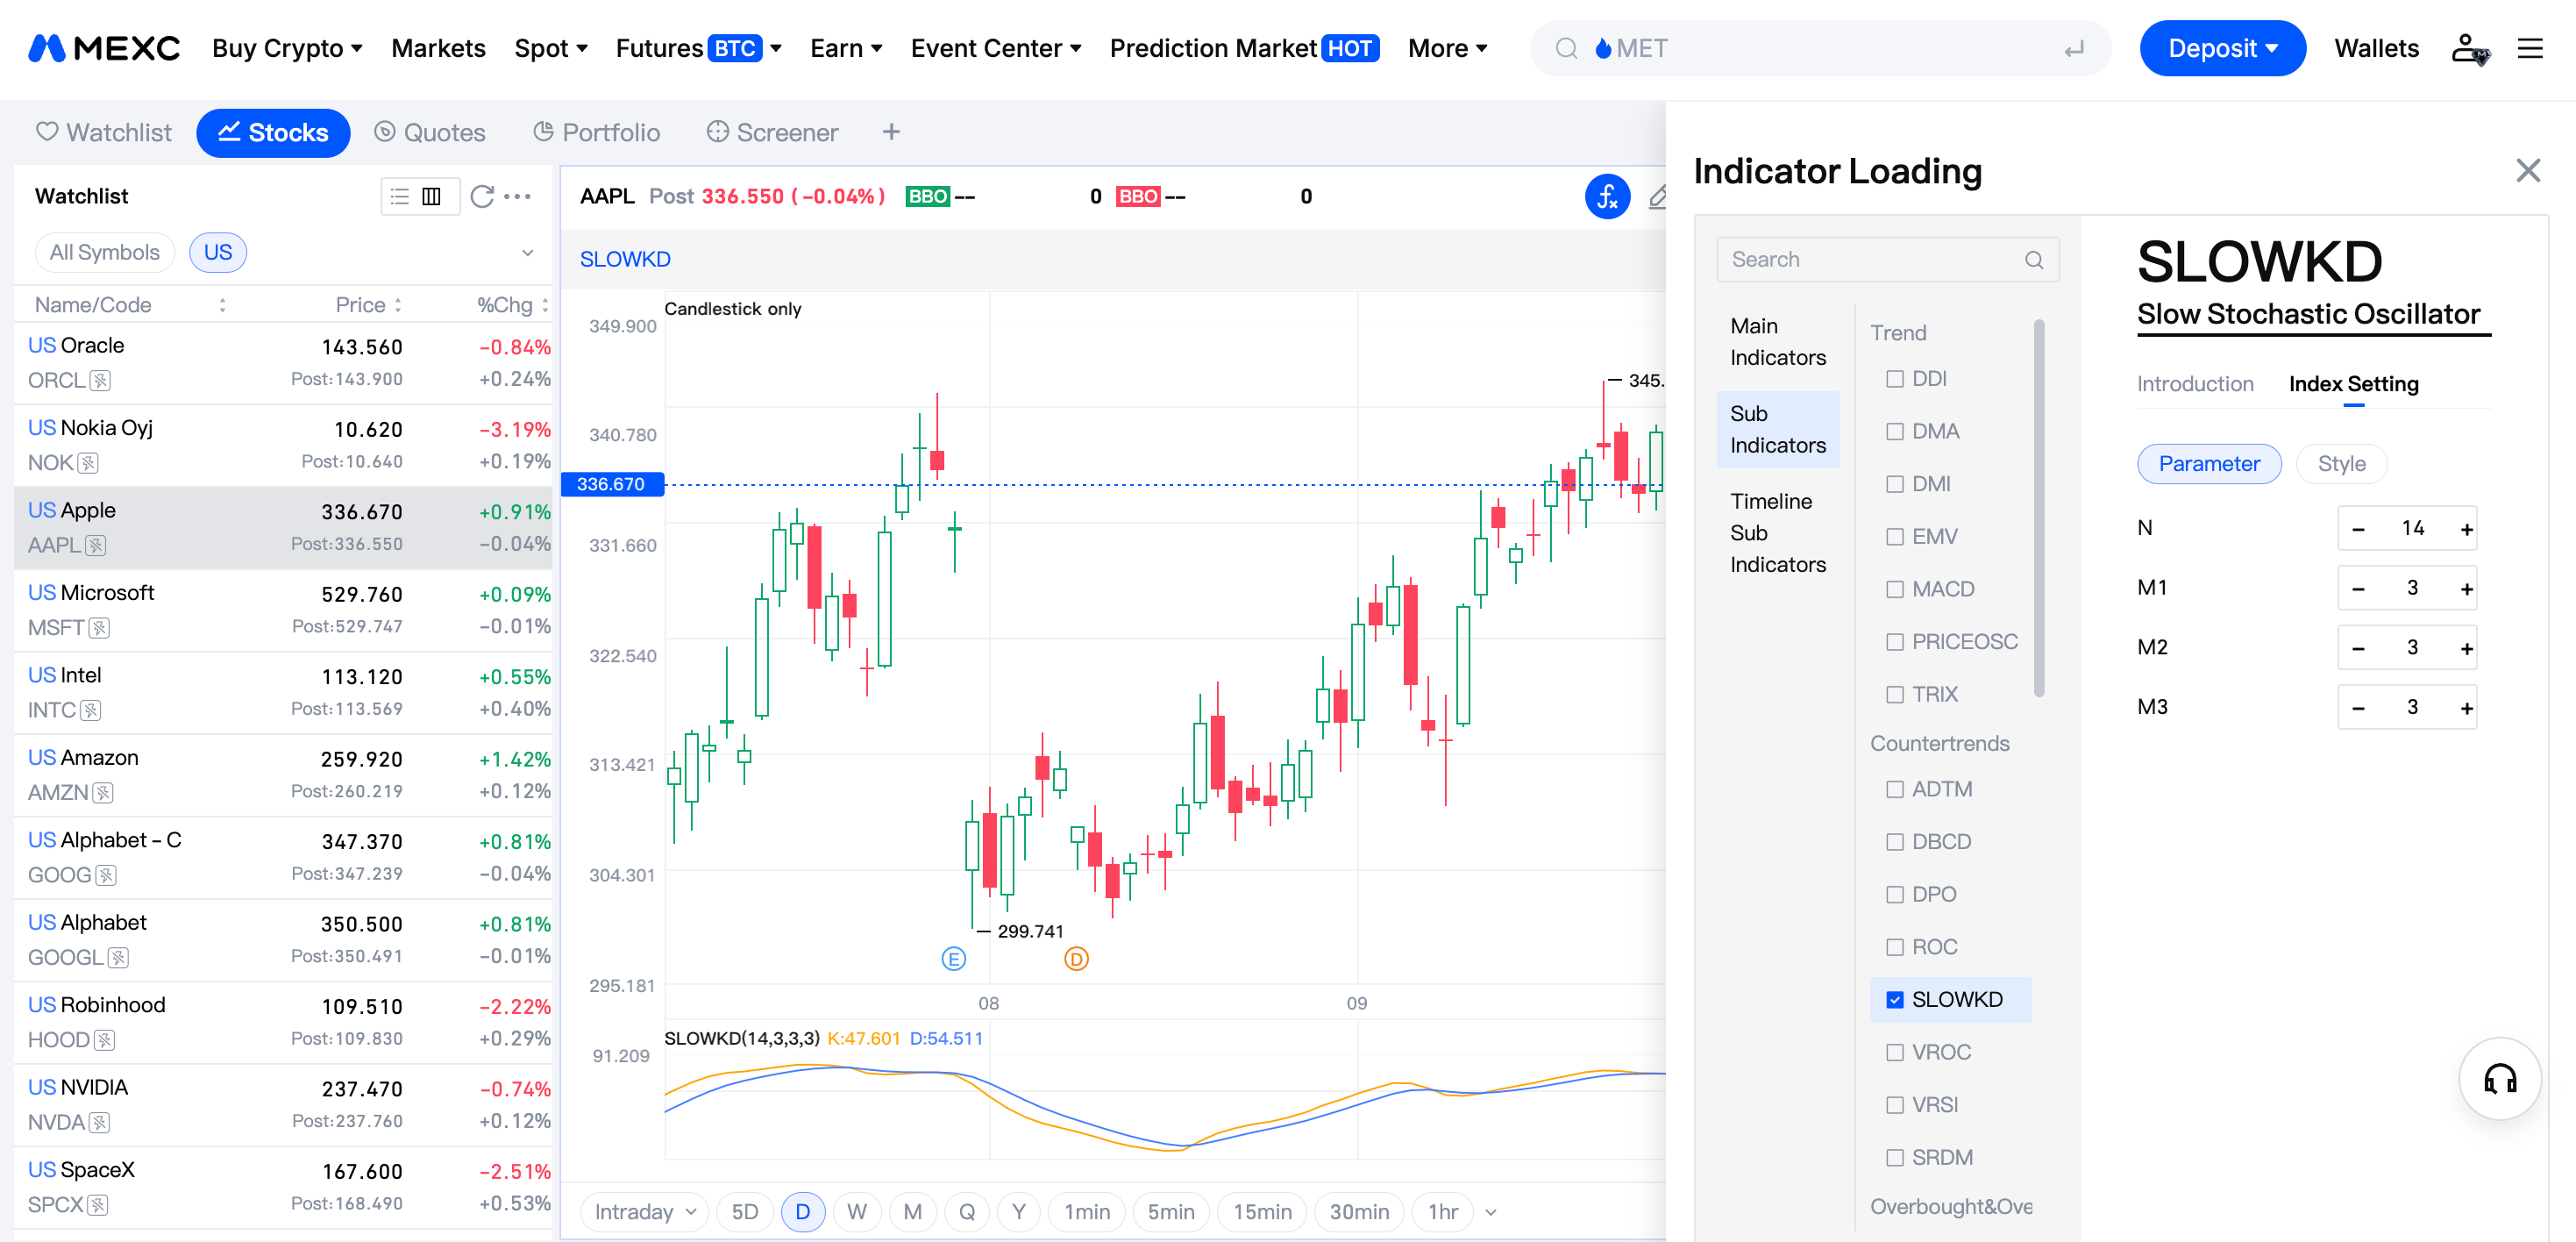

3. How to Identify Buy and Sell Signals With the Slow Stochastic Oscillator


1) Overbought and oversold conditions. A reading above 80 places the indicator in the overbought zone, where traders may watch for a potential pullback. A reading below 20 places it in the oversold zone, where traders may watch for a potential rebound. However, the indicator can remain above 80 during a strong uptrend or below 20 during a strong downtrend. A single reading should not be used as a standalone entry signal.

2) Golden cross and death cross signals. When the K line crosses above the D line near 20, traders may interpret it as a potential buy signal. When the K line crosses below the D line near 80, it may indicate a potential sell signal. Crossovers near the 50 midpoint generally provide less context than those near the extreme zones and should not be relied on alone.

3) Potential bottoming signals. If the indicator forms repeated bullish crossovers below 20 and then rises back above 20, it may suggest that a bottom is forming. Traders can use this as a potential entry signal, rather than treating it as proof that the bottoming process is complete.

4) Divergence patterns. Bullish divergence occurs when the price makes a lower low while the indicator forms a higher low, suggesting that downward momentum may be weakening. Bearish divergence occurs when the price makes a higher high while the indicator forms a lower high, suggesting that upward momentum may be fading. After a divergence appears, traders can wait for the indicator to cross the 50 midpoint in the expected direction or for the price to break a key support or resistance level before acting.

5) Trading with the trend. In an uptrend, focus on recoveries from oversold conditions rather than treating repeated overbought readings as automatic sell signals. In a downtrend, focus on declines from overbought conditions rather than treating repeated oversold readings as automatic buy signals. This helps align potential trades with the broader trend, but does not guarantee a higher win rate.

4. Fast vs. Slow Stochastic Oscillator


The fast stochastic oscillator uses the unsmoothed K value, producing a more volatile line and more frequent signals that can be misleading. The slow version typically applies an additional three-period moving average to K. This creates a smoother line that is less sensitive to price changes and helps filter market noise, although smoothing does not guarantee more accurate signals.

5. Slow Stochastic Oscillator vs. Relative Strength Index


The Relative Strength Index (RSI) is calculated from the magnitude of price gains and losses over a given period. The slow stochastic oscillator instead measures the closing price's position within the period's high-low range.

Despite its smoothing, the slow stochastic oscillator may move between overbought and oversold zones more frequently than RSI. RSI may produce fewer extreme readings, although the relative behavior of the two indicators depends on their settings and market conditions. Neither is universally better. Many traders use them together to cross-check signals.

6. Tips for Using the Slow Stochastic Oscillator on MEXC


MEXC's U.S. stock trading interface includes candlestick charting tools that let users add SLOWKD and customize its parameters. Beginners can follow these principles:

1) Combine the slow stochastic oscillator with trendlines, support and resistance levels, and other technical analysis tools to look for opportunities supported by multiple signals.

2) Test a strategy with small positions before considering a gradual increase in position size.

3) Always set a stop-loss. Technical indicators can help assess probabilities, but no indicator can guarantee that every signal will be accurate.


7. Slow Stochastic Oscillator FAQ


7.1 What are the best settings for the slow stochastic oscillator?


A common starting point is (14, 3, 3). Short-term traders may use (5, 3, 3) for greater sensitivity, while swing traders may use (20, 5, 5) to reduce market noise. The most suitable settings depend on the trading timeframe and market conditions.

7.2 How can the slow stochastic oscillator help identify entry and exit points?


A K line crossover above the D line near 20 may indicate a potential buy signal, while a crossover below the D line near 80 may indicate a potential sell signal. A move back above 20 from the oversold zone can support a rebound signal, while a move below 80 from the overbought zone can support a pullback signal. Assess these signals alongside divergence patterns and the broader trend.

7.3 Is the slow stochastic oscillator better than RSI?


The slow stochastic oscillator can be more sensitive and generate more signals in range-bound markets, while RSI may produce fewer extreme readings. Their behavior depends on the settings and market conditions. Neither is universally better, and the two can be used together to cross-check signals.

7.4 What is the difference between the fast and slow stochastic oscillators?


The fast version uses the unsmoothed K value, producing a more volatile line and frequent signals. The slow version typically smooths K with a three-period moving average to help filter market noise. With the standard three-period smoothing, the slow version's K value equals the fast version's D value.

7.5 Should I sell immediately when the slow stochastic oscillator rises above 80?


No. An overbought reading does not necessarily mean the price will fall. The indicator can remain above 80 for an extended period during a strong uptrend. Instead of selling solely because it is overbought, traders may wait for it to fall below 80 and look for confirmation from price patterns before making a decision.

How to Use the Slow Stochastic Oscillator (SLOWKD) in U.S. Stock Trading: A Complete Beginner's Guide

Key Takeaways:

  • The slow stochastic oscillator is a momentum indicator that fluctuates between 0 and 100.
  • It smooths short-term price fluctuations, producing a steadier line than the fast version and helping filter market noise.
  • A common parameter setting is (14, 3, 3). Readings above 80 indicate overbought conditions, while readings below 20 indicate oversold conditions.
  • Crossovers between the K and D lines and divergence patterns are key tools for identifying potential buy and sell signals.
  • The same analytical principles can also be applied to cryptocurrency trading on MEXC.

1. What Is the Slow Stochastic Oscillator?


The slow stochastic oscillator (SLOWKD) is a smoothed version of the momentum indicator developed by George Lane in the late 1950s. It measures where the closing price sits within the high-low range over a given period. Traders use it to identify potential trend reversals.

The slow stochastic oscillator builds on the original stochastic oscillator, also known as the fast stochastic oscillator. It applies a moving average to the K value to smooth short-term price fluctuations and help filter market noise when assessing potential entries and exits. Its values remain between 0 and 100, making it useful for identifying overbought and oversold conditions.

2. Slow Stochastic Oscillator Settings


A common parameter combination for the slow stochastic oscillator is (14, 3, 3). The first number, 14, represents the lookback period, which can be measured in days, weeks, or intraday intervals. The second number, 3, is the moving average period used to smooth the K value. The third number, 3, is the moving average period used to calculate the D value.

Settings can be adjusted to suit different trading styles. A shorter lookback period, such as 5 or 10, makes the indicator more sensitive, generating more signals but also more market noise. This may suit short-term traders. A longer lookback period, such as 20, produces a smoother indicator with fewer signals and may suit swing traders. Some short-term traders use (5, 3, 3) for greater sensitivity. On MEXC, users can customize the SLOWKD parameters available in the U.S. stock chart's "Index Loading" panel to suit different instruments' volatility.


3. How to Identify Buy and Sell Signals With the Slow Stochastic Oscillator


1) Overbought and oversold conditions. A reading above 80 places the indicator in the overbought zone, where traders may watch for a potential pullback. A reading below 20 places it in the oversold zone, where traders may watch for a potential rebound. However, the indicator can remain above 80 during a strong uptrend or below 20 during a strong downtrend. A single reading should not be used as a standalone entry signal.

2) Golden cross and death cross signals. When the K line crosses above the D line near 20, traders may interpret it as a potential buy signal. When the K line crosses below the D line near 80, it may indicate a potential sell signal. Crossovers near the 50 midpoint generally provide less context than those near the extreme zones and should not be relied on alone.

3) Potential bottoming signals. If the indicator forms repeated bullish crossovers below 20 and then rises back above 20, it may suggest that a bottom is forming. Traders can use this as a potential entry signal, rather than treating it as proof that the bottoming process is complete.

4) Divergence patterns. Bullish divergence occurs when the price makes a lower low while the indicator forms a higher low, suggesting that downward momentum may be weakening. Bearish divergence occurs when the price makes a higher high while the indicator forms a lower high, suggesting that upward momentum may be fading. After a divergence appears, traders can wait for the indicator to cross the 50 midpoint in the expected direction or for the price to break a key support or resistance level before acting.

5) Trading with the trend. In an uptrend, focus on recoveries from oversold conditions rather than treating repeated overbought readings as automatic sell signals. In a downtrend, focus on declines from overbought conditions rather than treating repeated oversold readings as automatic buy signals. This helps align potential trades with the broader trend, but does not guarantee a higher win rate.

4. Fast vs. Slow Stochastic Oscillator


The fast stochastic oscillator uses the unsmoothed K value, producing a more volatile line and more frequent signals that can be misleading. The slow version typically applies an additional three-period moving average to K. This creates a smoother line that is less sensitive to price changes and helps filter market noise, although smoothing does not guarantee more accurate signals.

5. Slow Stochastic Oscillator vs. Relative Strength Index


The Relative Strength Index (RSI) is calculated from the magnitude of price gains and losses over a given period. The slow stochastic oscillator instead measures the closing price's position within the period's high-low range.

Despite its smoothing, the slow stochastic oscillator may move between overbought and oversold zones more frequently than RSI. RSI may produce fewer extreme readings, although the relative behavior of the two indicators depends on their settings and market conditions. Neither is universally better. Many traders use them together to cross-check signals.

6. Tips for Using the Slow Stochastic Oscillator on MEXC


MEXC's U.S. stock trading interface includes candlestick charting tools that let users add SLOWKD and customize its parameters. Beginners can follow these principles:

1) Combine the slow stochastic oscillator with trendlines, support and resistance levels, and other technical analysis tools to look for opportunities supported by multiple signals.

2) Test a strategy with small positions before considering a gradual increase in position size.

3) Always set a stop-loss. Technical indicators can help assess probabilities, but no indicator can guarantee that every signal will be accurate.


7. Slow Stochastic Oscillator FAQ


7.1 What are the best settings for the slow stochastic oscillator?


A common starting point is (14, 3, 3). Short-term traders may use (5, 3, 3) for greater sensitivity, while swing traders may use (20, 5, 5) to reduce market noise. The most suitable settings depend on the trading timeframe and market conditions.

7.2 How can the slow stochastic oscillator help identify entry and exit points?


A K line crossover above the D line near 20 may indicate a potential buy signal, while a crossover below the D line near 80 may indicate a potential sell signal. A move back above 20 from the oversold zone can support a rebound signal, while a move below 80 from the overbought zone can support a pullback signal. Assess these signals alongside divergence patterns and the broader trend.

7.3 Is the slow stochastic oscillator better than RSI?


The slow stochastic oscillator can be more sensitive and generate more signals in range-bound markets, while RSI may produce fewer extreme readings. Their behavior depends on the settings and market conditions. Neither is universally better, and the two can be used together to cross-check signals.

7.4 What is the difference between the fast and slow stochastic oscillators?


The fast version uses the unsmoothed K value, producing a more volatile line and frequent signals. The slow version typically smooths K with a three-period moving average to help filter market noise. With the standard three-period smoothing, the slow version's K value equals the fast version's D value.

7.5 Should I sell immediately when the slow stochastic oscillator rises above 80?


No. An overbought reading does not necessarily mean the price will fall. The indicator can remain above 80 for an extended period during a strong uptrend. Instead of selling solely because it is overbought, traders may wait for it to fall below 80 and look for confirmation from price patterns before making a decision.