Beli Kripto
Pasar
Spot
Futures OILBTC
Tabungan
Pusat Acara
Hub Hadiah
Lainnya
PoR 100%+
What Is an Inverted Hammer Candlestick? A Beginner's Guide to Identifying and Trading the PatternWhat Is an Inverted Hammer Candlestick? A Beginner's Guide to Identifying and Trading the Pattern
Daftar Kategori
Batalkan

What Is an Inverted Hammer Candlestick? A Beginner's Guide to Identifying and Trading the Pattern

Key Takeaways:

  • The inverted hammer is a bullish reversal candlestick pattern that appears near the end of a downtrend and is commonly used to identify potential market bottoms.
  • An inverted hammer has a small body, a long upper shadow, and a very short lower shadow. The upper shadow is at least twice the length of the body.
  • An inverted hammer requires confirmation from a subsequent candlestick. On its own, it is not a reliable buy signal.
  • A green inverted hammer is generally considered a stronger bullish signal than a red one. Volume analysis can help assess the signal's reliability.
  • MEXC offers candlestick charts and technical analysis tools to help users identify and apply the inverted hammer pattern.

1. What Is an Inverted Hammer?


The inverted hammer is a classic single-candlestick pattern in technical analysis. It typically appears near the end of a downtrend and suggests a possible shift from bearish to bullish price action. As its name suggests, it looks like an upside-down hammer on a chart, with a small body near the bottom and a long shadow extending above it.

The inverted hammer belongs to the Japanese candlestick tradition, which traces its roots to rice trading and the work of Japanese trader Munehisa Homma before spreading to financial markets worldwide. Today, the pattern is widely used to analyze stocks, forex, commodities, and cryptocurrencies. Users can observe and identify it on MEXC's professional candlestick charts.

2. The Structure of an Inverted Hammer


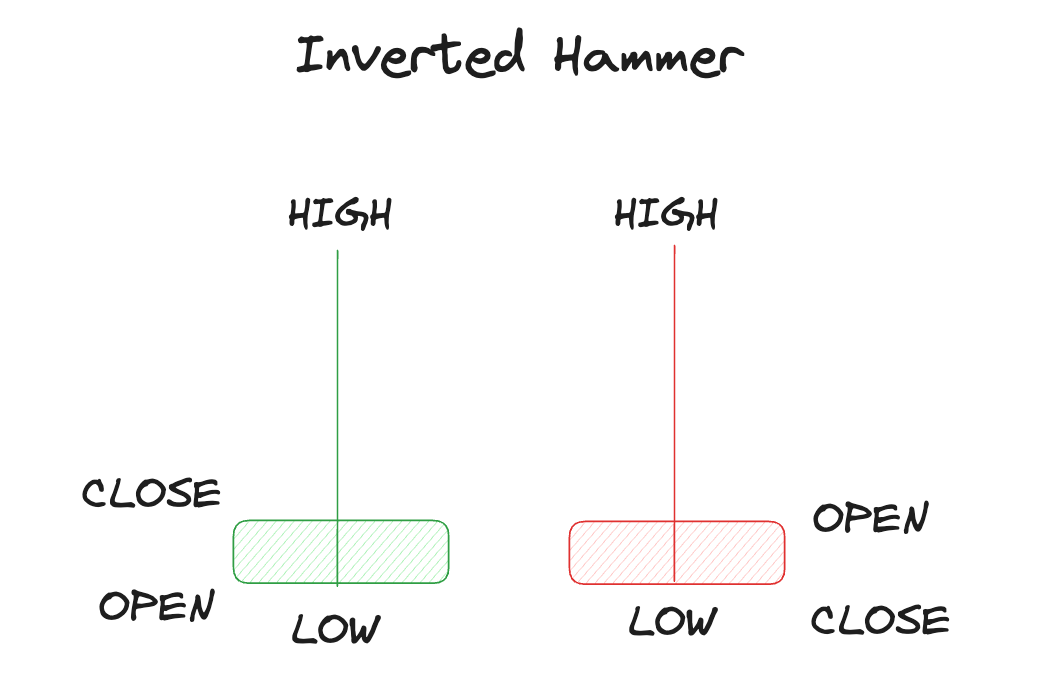
A standard inverted hammer consists of three key components:

1) Small body: The opening and closing prices are close together, with the body positioned near the bottom of the candlestick's range. This reflects a temporary standoff between buyers and sellers.

2) Long upper shadow: The upper shadow is at least twice the length of the body. It shows that buyers pushed the price significantly higher during the session before sellers drove it back down, suggesting that buying pressure may be building.

3) Very short or no lower shadow: This suggests that sellers were unable to push the price much lower and that bearish momentum may be nearing exhaustion.

3. Is an Inverted Hammer Bullish or Bearish?


An inverted hammer that forms after a downtrend is considered a bullish reversal signal. It reflects a market in which sellers have been driving prices lower, but buyers begin to push back during the session. Although buyers fail to hold all of the gains, they resist further declines. This shift in the balance between buying and selling pressure may precede a trend reversal.

The pattern's position is crucial to its interpretation. If a candlestick with the same shape appears at the top of an uptrend, it is called a shooting star, not an inverted hammer, and is considered a bearish reversal signal. Identifying the preceding trend is therefore essential to using the pattern correctly.

4. How to Identify an Inverted Hammer


Beginners can use the following four steps to identify an inverted hammer:

1) Confirm the downtrend. An inverted hammer is meaningful only after a clear decline. Its signals are less reliable in sideways markets.

2) Check the candlestick's shape. Look for a small body near the bottom of the range, an upper shadow at least twice the length of the body, and a very short or nonexistent lower shadow.

3) Assess its location. An inverted hammer near a key support level or demand zone, or in oversold conditions, can lend greater credibility to a potential reversal.

4) Wait for confirmation. A close above the inverted hammer's high on the next candlestick provides bullish confirmation. Conversely, a break below the inverted hammer's low invalidates the setup.

5. Red vs. Green Inverted Hammers


The color of an inverted hammer's body is not the deciding factor, but it can influence how traders assess the signal's strength.

A green inverted hammer is a bullish candle with a closing price above its opening price. It indicates that buyers retained some advantage at the close and is generally considered a stronger bullish signal.

A red inverted hammer is a bearish candle with a closing price below its opening price. It suggests that sellers retained some control, making the bullish signal relatively weaker and calling for stronger follow-up confirmation before entry.

Regardless of color, a significant increase in volume as the pattern forms indicates greater market participation and may lend support to a potential reversal.

6. Inverted Hammer vs. Hammer and Shooting Star


Inverted hammer vs. hammer: Both patterns appear near the end of a downtrend and signal a potential bullish reversal. The hammer has a long lower shadow, showing strong rejection of lower prices by buyers. The inverted hammer has a long upper shadow, reflecting a more tentative attempt by buyers to push prices higher. As a result, the inverted hammer relies more heavily on confirmation from subsequent candlesticks.

Inverted hammer vs. shooting star: The two patterns have the same shape but different trend contexts. An inverted hammer forms near the bottom of a downtrend and signals a potential bullish reversal. A shooting star forms near the top of an uptrend and signals a potential bearish reversal.


7. How to Trade the Inverted Hammer Pattern on MEXC


MEXC's candlestick charts allow users to identify and analyze inverted hammer patterns. Users can combine the pattern with the platform's technical indicators when developing a trading plan:

Entry timing: After identifying an inverted hammer near the bottom of a downtrend, wait for the next candlestick to close for confirmation. A long position may be considered if that candlestick closes above the inverted hammer's high.

Stop-loss placement: A stop-loss may be placed below the inverted hammer's low to help limit losses if the reversal fails.

Take-profit targets: A target may be set near the nearest resistance level or based on a risk-to-reward ratio of 1:2 or 1:3.

Additional confirmation: Combine the pattern with tools such as the Relative Strength Index (RSI), moving averages, and trading volume for additional confirmation. An inverted hammer near support, accompanied by bullish divergence in the RSI, can provide a more credible signal. Patterns on longer timeframes, such as daily or weekly charts, are also generally considered more reliable than those on shorter timeframes.


8. Advantages and Limitations of the Inverted Hammer


Advantages: The pattern's distinctive shape makes it relatively easy for beginners to identify. It can offer an early indication of a potential reversal near a market bottom and can be useful when combined with other indicators.

Limitations: The pattern can generate false signals when used alone, making confirmation essential. It is less effective in choppy markets, and even a confirmed reversal does not guarantee a sustained uptrend. Disciplined risk management and position sizing therefore remain essential.

9. Inverted Hammer FAQ


9.1 Is an inverted hammer a bullish signal?


Yes. When it appears near the end of a downtrend, an inverted hammer is considered a bullish reversal signal. It suggests that buying pressure may be strengthening and that the decline could give way to a recovery. However, confirmation from the next candlestick is needed before acting on the signal.

9.2 Are an inverted hammer and a shooting star the same?


They have the same shape but opposite implications. An inverted hammer appears near the bottom of a downtrend and is a bullish signal, while a shooting star appears near the top of an uptrend and is a bearish signal. The key distinction is the direction of the trend preceding the pattern.

9.3 What does a red inverted hammer mean?


A red inverted hammer means that the closing price is below the opening price. It can still indicate a potential bullish reversal, but it is generally considered a weaker signal than a green inverted hammer and calls for stronger confirmation before a trade.

9.4 Is a green inverted hammer bullish?


Yes. A green inverted hammer shows that buyers pushed the closing price above the opening price. It is generally considered a stronger bullish reversal signal, and an accompanying increase in volume can provide additional support.

9.5 What does an inverted hammer in an uptrend mean?


A candlestick with this shape in an uptrend is called a shooting star. It is a bearish reversal signal suggesting that buying momentum may be fading and sellers may be regaining control, potentially bringing the rally to an end.

9.6 What does an inverted hammer reveal about the market?


It reflects the balance between buyers and sellers. Buyers pushed the price significantly higher during the session before sellers drove it back down. This attempt to move higher may suggest that sellers' control is weakening and that the balance of buying and selling pressure could be shifting.

9.7 How can traders improve the reliability of inverted hammer setups?


Follow four principles: use the pattern only after a clear downtrend; wait for the confirmation candlestick to close; assess it alongside support levels, volume, and indicators such as the RSI; and apply disciplined stop-loss placement and position sizing. MEXC's charting tools allow users to combine these checks to make more informed trading decisions.

What Is an Inverted Hammer Candlestick? A Beginner's Guide to Identifying and Trading the Pattern

Key Takeaways:

  • The inverted hammer is a bullish reversal candlestick pattern that appears near the end of a downtrend and is commonly used to identify potential market bottoms.
  • An inverted hammer has a small body, a long upper shadow, and a very short lower shadow. The upper shadow is at least twice the length of the body.
  • An inverted hammer requires confirmation from a subsequent candlestick. On its own, it is not a reliable buy signal.
  • A green inverted hammer is generally considered a stronger bullish signal than a red one. Volume analysis can help assess the signal's reliability.
  • MEXC offers candlestick charts and technical analysis tools to help users identify and apply the inverted hammer pattern.

1. What Is an Inverted Hammer?


The inverted hammer is a classic single-candlestick pattern in technical analysis. It typically appears near the end of a downtrend and suggests a possible shift from bearish to bullish price action. As its name suggests, it looks like an upside-down hammer on a chart, with a small body near the bottom and a long shadow extending above it.

The inverted hammer belongs to the Japanese candlestick tradition, which traces its roots to rice trading and the work of Japanese trader Munehisa Homma before spreading to financial markets worldwide. Today, the pattern is widely used to analyze stocks, forex, commodities, and cryptocurrencies. Users can observe and identify it on MEXC's professional candlestick charts.

2. The Structure of an Inverted Hammer


A standard inverted hammer consists of three key components:

1) Small body: The opening and closing prices are close together, with the body positioned near the bottom of the candlestick's range. This reflects a temporary standoff between buyers and sellers.

2) Long upper shadow: The upper shadow is at least twice the length of the body. It shows that buyers pushed the price significantly higher during the session before sellers drove it back down, suggesting that buying pressure may be building.

3) Very short or no lower shadow: This suggests that sellers were unable to push the price much lower and that bearish momentum may be nearing exhaustion.


3. Is an Inverted Hammer Bullish or Bearish?


An inverted hammer that forms after a downtrend is considered a bullish reversal signal. It reflects a market in which sellers have been driving prices lower, but buyers begin to push back during the session. Although buyers fail to hold all of the gains, they resist further declines. This shift in the balance between buying and selling pressure may precede a trend reversal.

The pattern's position is crucial to its interpretation. If a candlestick with the same shape appears at the top of an uptrend, it is called a shooting star, not an inverted hammer, and is considered a bearish reversal signal. Identifying the preceding trend is therefore essential to using the pattern correctly.

4. How to Identify an Inverted Hammer


Beginners can use the following four steps to identify an inverted hammer:

1) Confirm the downtrend. An inverted hammer is meaningful only after a clear decline. Its signals are less reliable in sideways markets.

2) Check the candlestick's shape. Look for a small body near the bottom of the range, an upper shadow at least twice the length of the body, and a very short or nonexistent lower shadow.

3) Assess its location. An inverted hammer near a key support level or demand zone, or in oversold conditions, can lend greater credibility to a potential reversal.

4) Wait for confirmation. A close above the inverted hammer's high on the next candlestick provides bullish confirmation. Conversely, a break below the inverted hammer's low invalidates the setup.

5. Red vs. Green Inverted Hammers


The color of an inverted hammer's body is not the deciding factor, but it can influence how traders assess the signal's strength.

A green inverted hammer is a bullish candle with a closing price above its opening price. It indicates that buyers retained some advantage at the close and is generally considered a stronger bullish signal.

A red inverted hammer is a bearish candle with a closing price below its opening price. It suggests that sellers retained some control, making the bullish signal relatively weaker and calling for stronger follow-up confirmation before entry.

Regardless of color, a significant increase in volume as the pattern forms indicates greater market participation and may lend support to a potential reversal.

6. Inverted Hammer vs. Hammer and Shooting Star


Inverted hammer vs. hammer: Both patterns appear near the end of a downtrend and signal a potential bullish reversal. The hammer has a long lower shadow, showing strong rejection of lower prices by buyers. The inverted hammer has a long upper shadow, reflecting a more tentative attempt by buyers to push prices higher. As a result, the inverted hammer relies more heavily on confirmation from subsequent candlesticks.

Inverted hammer vs. shooting star: The two patterns have the same shape but different trend contexts. An inverted hammer forms near the bottom of a downtrend and signals a potential bullish reversal. A shooting star forms near the top of an uptrend and signals a potential bearish reversal.


7. How to Trade the Inverted Hammer Pattern on MEXC


MEXC's candlestick charts allow users to identify and analyze inverted hammer patterns. Users can combine the pattern with the platform's technical indicators when developing a trading plan:

Entry timing: After identifying an inverted hammer near the bottom of a downtrend, wait for the next candlestick to close for confirmation. A long position may be considered if that candlestick closes above the inverted hammer's high.

Stop-loss placement: A stop-loss may be placed below the inverted hammer's low to help limit losses if the reversal fails.

Take-profit targets: A target may be set near the nearest resistance level or based on a risk-to-reward ratio of 1:2 or 1:3.

Additional confirmation: Combine the pattern with tools such as the Relative Strength Index (RSI), moving averages, and trading volume for additional confirmation. An inverted hammer near support, accompanied by bullish divergence in the RSI, can provide a more credible signal. Patterns on longer timeframes, such as daily or weekly charts, are also generally considered more reliable than those on shorter timeframes.


8. Advantages and Limitations of the Inverted Hammer


Advantages: The pattern's distinctive shape makes it relatively easy for beginners to identify. It can offer an early indication of a potential reversal near a market bottom and can be useful when combined with other indicators.

Limitations: The pattern can generate false signals when used alone, making confirmation essential. It is less effective in choppy markets, and even a confirmed reversal does not guarantee a sustained uptrend. Disciplined risk management and position sizing therefore remain essential.

9. Inverted Hammer FAQ


9.1 Is an inverted hammer a bullish signal?


Yes. When it appears near the end of a downtrend, an inverted hammer is considered a bullish reversal signal. It suggests that buying pressure may be strengthening and that the decline could give way to a recovery. However, confirmation from the next candlestick is needed before acting on the signal.

9.2 Are an inverted hammer and a shooting star the same?


They have the same shape but opposite implications. An inverted hammer appears near the bottom of a downtrend and is a bullish signal, while a shooting star appears near the top of an uptrend and is a bearish signal. The key distinction is the direction of the trend preceding the pattern.

9.3 What does a red inverted hammer mean?


A red inverted hammer means that the closing price is below the opening price. It can still indicate a potential bullish reversal, but it is generally considered a weaker signal than a green inverted hammer and calls for stronger confirmation before a trade.

9.4 Is a green inverted hammer bullish?


Yes. A green inverted hammer shows that buyers pushed the closing price above the opening price. It is generally considered a stronger bullish reversal signal, and an accompanying increase in volume can provide additional support.

9.5 What does an inverted hammer in an uptrend mean?


A candlestick with this shape in an uptrend is called a shooting star. It is a bearish reversal signal suggesting that buying momentum may be fading and sellers may be regaining control, potentially bringing the rally to an end.

9.6 What does an inverted hammer reveal about the market?


It reflects the balance between buyers and sellers. Buyers pushed the price significantly higher during the session before sellers drove it back down. This attempt to move higher may suggest that sellers' control is weakening and that the balance of buying and selling pressure could be shifting.

9.7 How can traders improve the reliability of inverted hammer setups?


Follow four principles: use the pattern only after a clear downtrend; wait for the confirmation candlestick to close; assess it alongside support levels, volume, and indicators such as the RSI; and apply disciplined stop-loss placement and position sizing. MEXC's charting tools allow users to combine these checks to make more informed trading decisions.