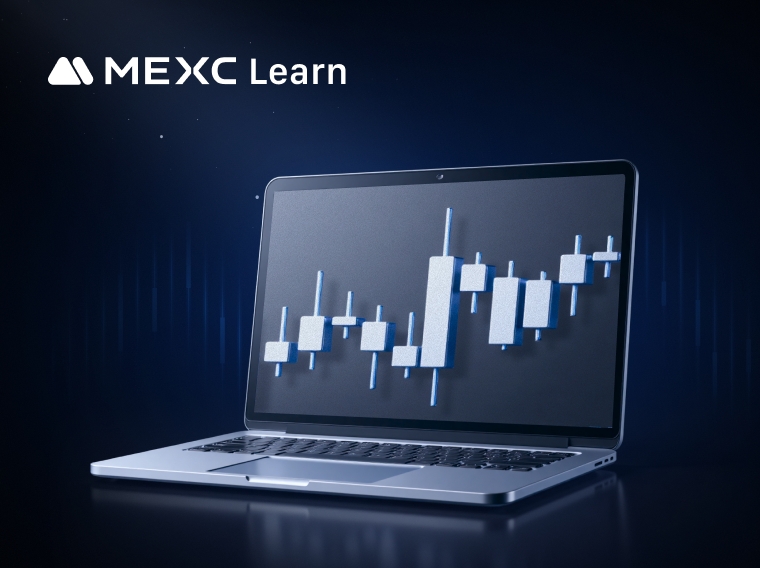
TradingView is a powerful trading analysis tool that caters to users of all experience levels. MEXC has integrated TradingView's charting tools, allowing you to use them directly on the MEXCTradingView is a powerful trading analysis tool that caters to users of all experience levels. MEXC has integrated TradingView's charting tools, allowing you to use them directly on the MEXC
Belajar/Trading Guide/Technical Indicators/How to Use TradingView on MEXC

How to Use TradingView on MEXC

Sep 21, 2026MEXC
3 menit

TradingView is a powerful trading analysis tool that caters to users of all experience levels. MEXC has integrated TradingView's charting tools, allowing you to use them directly on the MEXC platform.

How to Use TradingView on MEXC


We will demonstrate TradingView chart features using the spot trading page as an example. The setup for the futures trading page is identical to the spot trading page.

1. Setting Up the K-Line Chart


The K-line chart, also commonly referred to as the candlestick chart, typically defaults to solid green for rises and red for falls. In Japan and Korea, it often defaults to solid red for rises and blue for falls. By hovering your mouse over the K-line icon, you can see 8 different styles of K-line charts, and you can switch to the corresponding style of K-line chart by clicking on it.


Additionally, you can click the chart icon above the K-line chart to open the "Chart Settings" page. In the first section, indicated by a K-line icon, you can make more custom settings for candle colors, price line colors, time zone, and more.


2. Common Drawing Tools


On the left side of the chart, you will find commonly used drawing tools to help you analyze market trends. To use these drawing tools, click the corresponding icon on the left side, and then draw on the K-line chart. The process is simple and easy to use.


3. Using Technical Indicators


For more experienced traders, technical indicators are often used to analyze market trends. Click the technical indicators button above the K-line chart. In the "Indicators" list, scroll up and down or use the search function to find and add the technical indicators you need.


After adding a technical indicator, you can also adjust its parameters, style, and other settings according to your preferences. For example, to modify the Bollinger Bands (BB) indicator as shown in the image, click on the indicator on the K-line chart, then click the [⚙️] settings button at the top to open the BB indicator settings page. After making your adjustments, click [Ok] to save.

Additionally, you can click the eye icon to show or hide the technical indicator, or click the [X] icon to remove the indicator from the chart.


4. Time Zone Settings


To change the displayed time zone, simply click on the time zone information below the K-line chart. Changing the time zone will not affect the statistical values; it will only change the date and time.


5. Chart Settings


Earlier in the "Setting Up the K-Line Chart" section, we mentioned the chart settings. Click the chart icon above the K-line chart to open the "Chart Settings" page. The chart settings include four sections, listed from top to bottom: Candles, Symbol, Labels, and Chart Basic Styles.

  • Candles: Customize the candle colors, price line colors, precision, and time zone.
  • Symbol: Settings for the text information at the top of the K-line chart, including whether to display OHLC values, bar change values, and volume.
  • Labels: Offers various options to integrate labels into the chart, such as symbol name, high and low price, and countdown to bar close labels.
  • Chart Basic Styles: Customize the chart's background color, grid line color, and other settings.


6. How to Reset the Chart


If you want to remove any customizations you have made to the chart, right-click on the K-line chart and select [Reset chart view].


Disclaimer: This information does not provide advice on investment, taxation, legal, financial, accounting, consultation, or any other related services, nor does it constitute advice to purchase, sell, or hold any assets. MEXC Learn provides information for reference purposes only and does not constitute investment advice. Please ensure you fully understand the risks involved and exercise caution when investing. The platform is not responsible for users' investment decisions.

Peluang Pasar
Logo SynFutures
Harga SynFutures(F)
$0.003799
$0.003799$0.003799
+0.18%
USD
Grafik Harga Live SynFutures (F)

Artikel Populer

Lihat Selengkapnya
Cara Berdagang IPO di MEXC: Memilih Produk yang Tepat Sebelum, Selama, dan Setelah Listing

Cara Berdagang IPO di MEXC: Memilih Produk yang Tepat Sebelum, Selama, dan Setelah Listing

IPO terdiri dari tiga tahap, bukan satu momen. Sebelum pencatatan, Pre-IPO Launchpad memberikan eksposur berbasis peristiwa sementara Pre-IPO Futures memperdagangkan ekspektasi valuasi. Pada penawaran

Cara Memilih Antara Saham Riil, Saham Tokenisasi, Kontrak Saham, dan ETF

Cara Memilih Antara Saham Riil, Saham Tokenisasi, Kontrak Saham, dan ETF

Paparan terhadap perusahaan AS dapat diperoleh melalui beberapa jenis instrumen yang berbeda: saham tunai, ETF, Tokenized Stock berbasis aset, atau derivatif saham seperti Stock Future. Instrumen-inst

Premium, Diskon, dan Tracking Error pada Produk Terkait Saham

Premium, Diskon, dan Tracking Error pada Produk Terkait Saham

Produk yang terkait dengan saham dapat merujuk pada perusahaan atau indeks yang sama namun berbeda dalam harga pasar, total imbal hasil, biaya, likuiditas, dan struktur hukum. Tiga pengukuran sering d
Mengapa Produk Terkait Saham Mungkin Berdagang Berbeda Saat Pasar AS Tutup

Mengapa Produk Terkait Saham Mungkin Berdagang Berbeda Saat Pasar AS Tutup

Produk terkait saham dapat melacak saham AS yang mendasarinya dengan erat selama pasar kas utama aktif, kemudian berperilaku berbeda ketika pasar acuan tersebut tutup atau kurang aktif. Sekuritas yang

Berita yang Sedang Tren

Lihat Selengkapnya
OJK Atur Kompetensi Finfluencer dan Tanggung Jawab Promosi Kripto

OJK Atur Kompetensi Finfluencer dan Tanggung Jawab Promosi Kripto

OJK menerbitkan POJK 6/2026 yang mengatur kompetensi finfluencer serta tanggung jawab perusahaan atas promosi aset kripto di Indonesia.

Indonesia Blokir Akses Polymarket setelah Diklasifikasikan sebagai Judi Online

Indonesia Blokir Akses Polymarket setelah Diklasifikasikan sebagai Judi Online

Indonesia memblokir akses ke Polymarket setelah Komdigi mengklasifikasikan kontrak prediksinya sebagai judi online dan menelusuri akun terkait.

Pendapatan DCI Indonesia Naik 33,2% pada Semester I 2026

Pendapatan DCI Indonesia Naik 33,2% pada Semester I 2026

Pendapatan DCI Indonesia naik 33,2% menjadi Rp1,77 triliun pada semester I 2026, dengan layanan kolokasi menyumbang 94,5% dari penjualan.

Pengawasan Kripto Indonesia Beralih ke OJK Setelah Penerapan Sistem CFX

Pengawasan Kripto Indonesia Beralih ke OJK Setelah Penerapan Sistem CFX

OJK mengambil alih pengawasan kripto Indonesia dari Bappebti pada Januari 2025, memperbarui kerangka perdagangan yang melibatkan sistem CFX.

Artikel Terkait

Lihat Selengkapnya
Bagaimana dengan: Kuasai Tren Pasar dengan Indikator Perdagangan Kripto: Panduan Lengkap

Bagaimana dengan: Kuasai Tren Pasar dengan Indikator Perdagangan Kripto: Panduan Lengkap

Dalam perdagangan kripto, analisis indikator teknis mengacu pada metode kuantitatif yang menggunakan rumus matematika dan statistik untuk menilai tren pasar. Dengan memproses data harga dan volume mel
Pesaing Oura: Samsung, Apple, dan Pasar Smart Ring

Pesaing Oura: Samsung, Apple, dan Pasar Smart Ring

Menurut prospektus IPO-nya, pesaing Oura terbagi dalam tiga kelompok: pembuat jam tangan pintar seperti Apple, Google, dan Samsung; perangkat wearable kebugaran seperti Garmin, Coros, dan Whoop; serta
Apakah Oura Menguntungkan? Pendapatan, Model Bisnis, dan Valuasi

Apakah Oura Menguntungkan? Pendapatan, Model Bisnis, dan Valuasi

Ya, Oura menguntungkan berdasarkan laba bersih. Prospektus IPO-nya menunjukkan laba bersih sebesar $60,8 juta dari pendapatan $1,21 miliar dalam sembilan bulan hingga 30 Juni 2026. Kerugian $924,3 jut

Review Bitget 2026: Skor 3,8 dari 5, Copy Trading Paling Lengkap, dan Tiga Tanggal Penting Keluarnya Bitget dari Jepang

Review Bitget 2026: Skor 3,8 dari 5, Copy Trading Paling Lengkap, dan Tiga Tanggal Penting Keluarnya Bitget dari Jepang

Per 25 September 2026, Bitget meraih skor 3,8 dari 5 pada penilaian enam dimensi kami: unggul di derivatif, mendapat skor sementara 3,5 untuk keamanan setelah insiden hot wallet senilai sekitar US$351


Daftar di MEXC
Daftar & Dapatkan Bonus hingga 10,000 USDT
Apa DNA Wall Street Anda?
Apa DNA Wall Street Anda?Apa DNA Wall Street Anda?
6 orang. Setiap orang dapat bagian dari $30K NVDAX.

Gabung ke Komunitas MEXC

Dapatkan listing, acara, dan perkembangan terbaru secara real time langsung dari saluran Telegram resmi kami.

25 rb+ anggota